VWAP Deviation Analysis
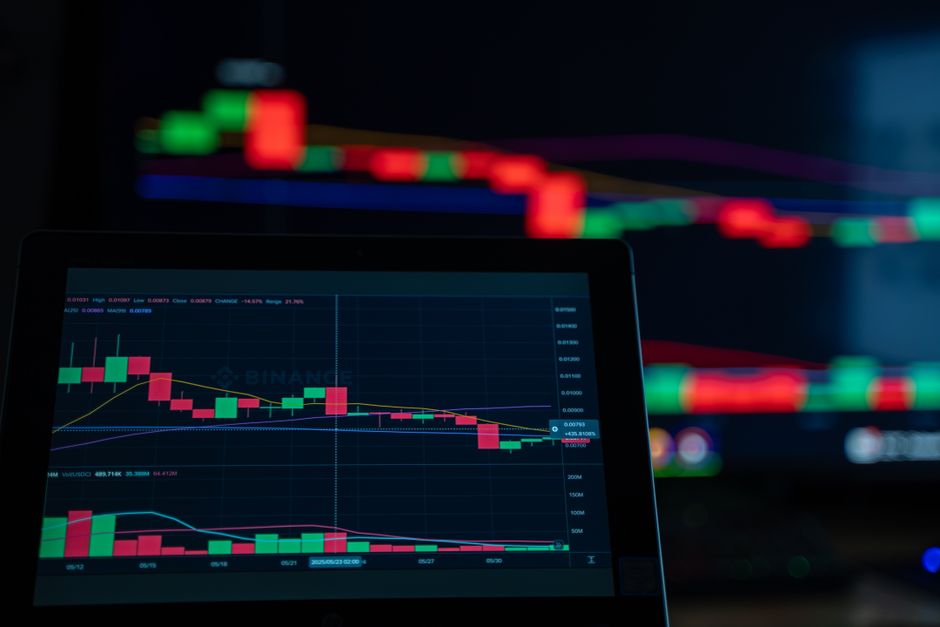
Price often reverts to the mean. Frequently, the distance from that mean just expands. The data at orb trading volume explainhownow shows that volume weighted average price provides a mechanical baseline for measuring this expansion during intraday sessions. This analysis tracks how much a security moves away from the average cost paid by participants. When the price stretches too far from the baseline, the trend strength reaches a limit. A deviation from the vwap indicates the intensity of the current move relative to the liquidity deposited throughout the day.
The Mechanics of VWAP Deviation
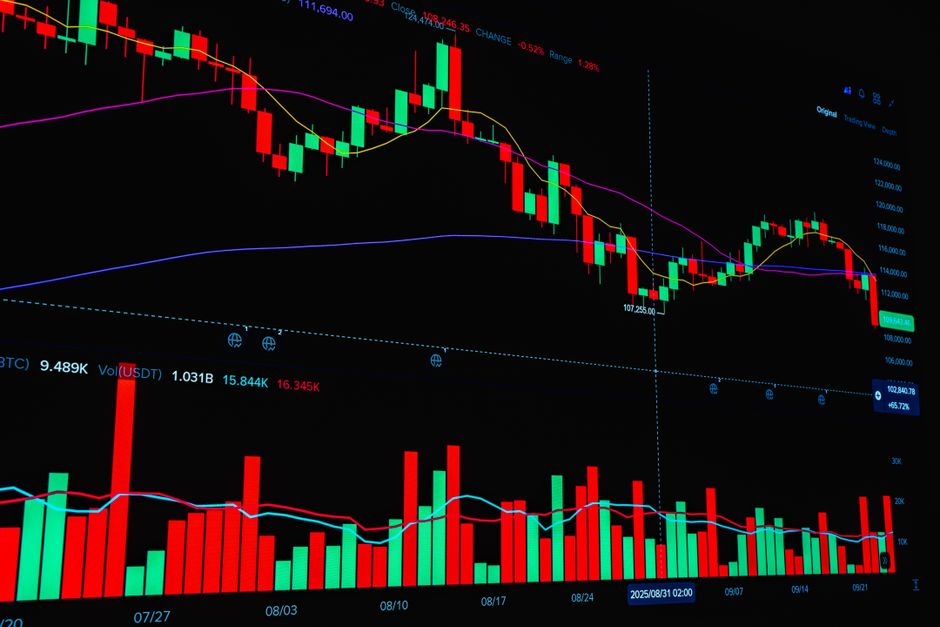
Calculating the distance between current price and the vwap requires a mathematical constant. A standard deviation band creates a corridor around the average. When the price enters the second or third standard deviation, the move enters an extreme state. This measurement does not predict a reversal. It simply quantifies the stretch. A large gap between the price and the vwap suggests that the current momentum is outpacing the cumulative volume. This happens often during the first hour of regular trading hours. The data shows that early volatility creates wide bands that tighten as the session progresses.
Establishing the Baseline
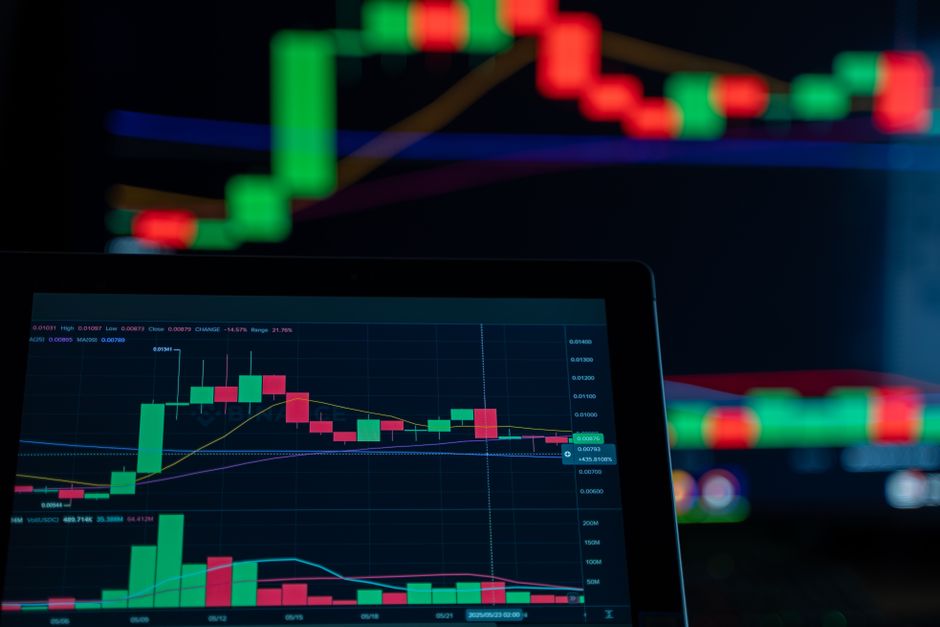
The vwap resets at the market open. It begins accumulating volume and price data from the opening bell. This reset makes it a dynamic indicator. Unlike a moving average, it incorporates every share traded since the session started. A trader observes how the price reacts to these bands. If a 15 minute candle closes far outside the second deviation, the trend is aggressive. If the price struggles to maintain distance from the vwap, the trend lacks the volume support to continue the expansion. The baseline acts as a magnet for liquidity.
Timeframe and Volatility Correlation
The scale of the deviation depends on the timeframe used for observation. A 5 minute chart reveals micro-fluctuations in price distance. These small deviations often mean nothing. However, when the deviation holds steady on a 30 minute chart, the trend carries more weight. The volume must be present to sustain a wide gap. High volume at a specific price level anchors the vwap. If price moves away from the anchor without a corresponding increase in volume, the gap is likely to close quickly. The math remains consistent regardless of the specific window.
Volume and Trend Strength
Volume is the fuel for deviation. A price move that occurs on low volume will naturally gravitate back toward the vwap. This is because the average cost of the participants has not shifted significantly. Conversely, a heavy influx of orders during the opening range creates a massive shift in the vwap. This creates a new baseline that can support further deviation. Tracking the relationship between the price spread and the volume profile allows for a mechanical assessment of trend exhaustion. The gap between the price and the average cost is the most direct metric for this task.