Absorption at Support and Resistance

Price should bounce when it hits a floor. Instead, it often sits there and hammers against the level until the floor breaks. The technical details found at orb trading volume explainhownow show how this absorption works during the intraday session. A trader looks for volume to confirm a move, but sometimes volume confirms a trap. High volume at a specific price level without a corresponding change in price indicates that large orders are soaking up all available liquidity. This process happens when aggressive market orders hit a massive passive limit order at a support or resistance level. The price stays pinned despite the aggressive effort.
Identifying High Volume Clusters
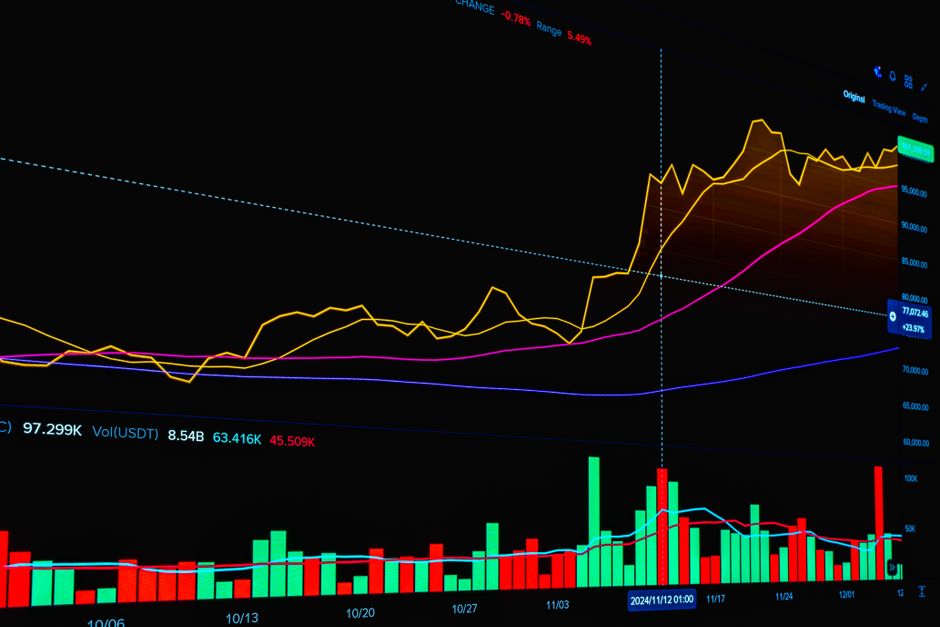
Absorption occurs when the tape shows heavy participation but the candle bodies remain small. A large volume spike on a five minute range candle that fails to close near its high suggests that a seller is absorbing every market buy order. This creates a cluster of activity. Instead of a rapid move away from the level, the price lingers. The lack of price displacement despite high volume is the mechanical signature of an institutional iceberg order. This often happens near the market open or during the first hour of regular trading hours. The goal is to spot the moment where the aggressive side runs out of steam against the passive side.
The Role of Timeframes
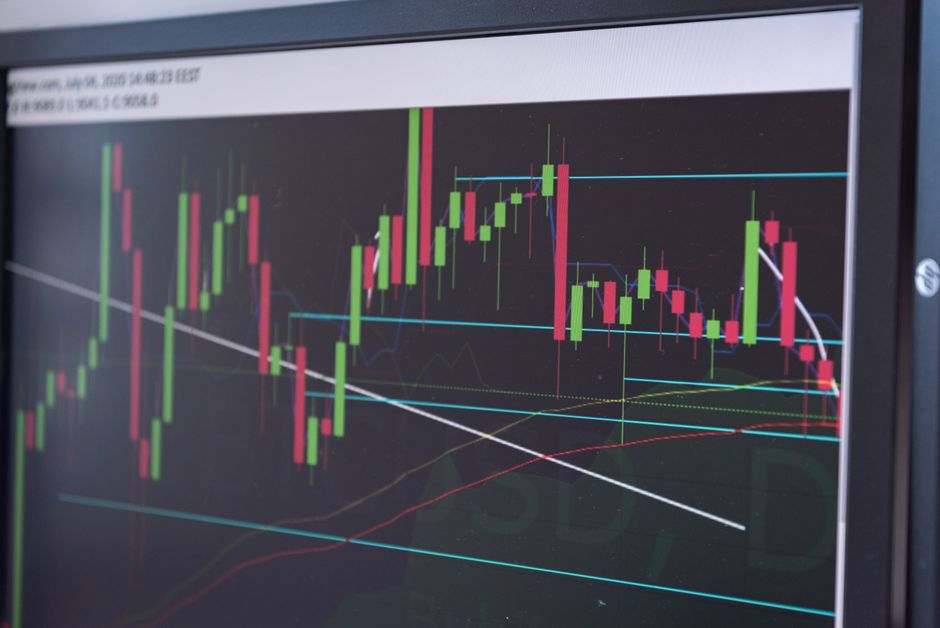
The scale of the absorption depends on the timeframe being watched. A cluster on a 5 minute chart might represent a minor pause, but a cluster on the thirty minute range indicates a major shift in supply or demand. If the price sits at a level through the first fifteen minutes and refuses to move, the absorption is significant. Looking at the sixty minute range helps confirm if the order soaking is a temporary pause or a total reversal of the intraday trend. Large orders often hide within the noise of the opening bell, requiring a larger window to see the true lack of movement.
Volume Profile and Absorption
Volume profile helps locate the exact price where the absorption is occurring. High volume nodes mark the areas where the most shares or contracts changed hands. When price reaches a high volume node and stalls, it confirms that the level is being defended. An opening range breakout often fails if the price hits a massive absorption zone immediately after the break. The breakout attempt uses a burst of momentum, but the passive orders at the node absorb the energy. This leaves the price stuck at the edge of the opening range.
Mechanical Execution
Detecting these levels requires watching the relationship between volume and price spread. If volume increases but the spread narrows, absorption is the cause. A trader watches for the exhaustion of the aggressive side. Once the market orders are exhausted, the price often moves rapidly in the opposite direction as the passive orders are revealed. This move is often fast because there is no liquidity left on the other side of the order book. Monitoring the session high or low for these clusters provides a specific point of interest for the remainder of the day.