Intraday Volume Climax Patterns
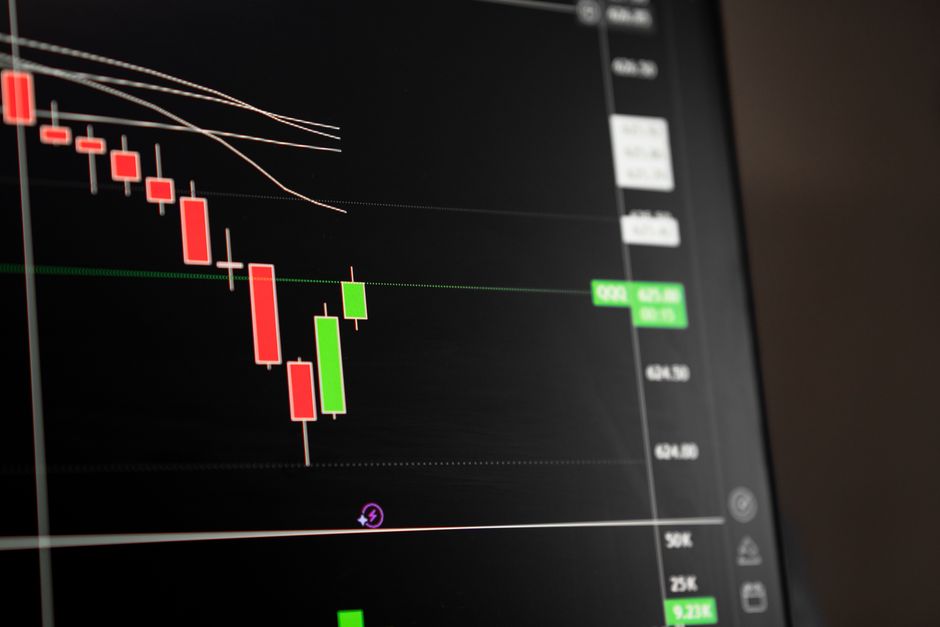
The volume spike identifies a specific mechanical event: it marks the point where liquidity exhaustion meets extreme order flow imbalance. Every teardown orb trading volume explainhownow has logged shows the same thing regarding intraday volume climax patterns. These spikes occur during the first hour of regular trading hours and represent the final push of a parabolic move. A sudden surge in volume within a 5 minute timeframe often signals that the last remaining buyers or sellers have entered the market, leaving no one left to continue the trend.
The Mechanics of Exhaustion

An intraday volume climax happens when the price moves aggressively in one direction while volume expands to levels far above the moving average. This is not a sign of strength. Instead, it reflects a blow off top or a capitulation bottom. When a candle breaks the opening range with massive volume, the following candles often show a failure to sustain that momentum. The mechanical reality is that the supply or demand has been temporarily cleared out. Once the orders are filled, the price lacks the fuel to maintain the current trajectory.
Identifying the Spike
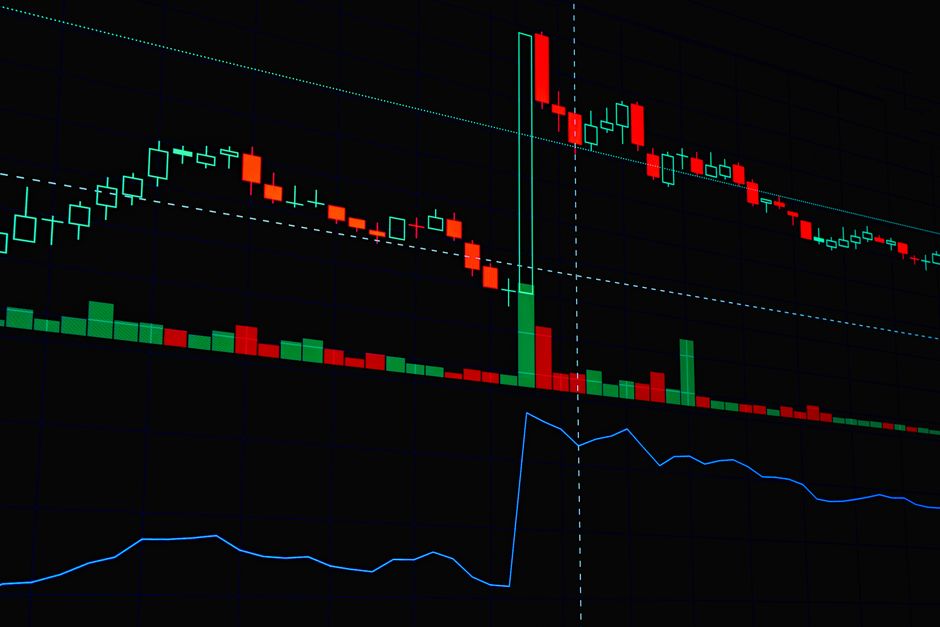
Detection requires looking at the relationship between price action and the volume bars. A climax typically appears as a tall candle with a volume bar that towers over the previous ten or twenty bars. This frequently happens shortly after the market open. If the price has been trending strongly since the cash open, the spike marks the transition from a trend to a mean reversion or a reversal. Watching the 15 minute range helps to filter out noise, as a climax within a larger timeframe carries more weight for the remainder of the session.
Volume vs. Price Divergence
A common signal occurs when the price makes a new session high but the subsequent volume fails to support a higher price level. This divergence indicates that the selling pressure is absorbing the buying pressure. If the volume climax occurs near the thirty minute range boundary, the probability of a reversal increases. The work involves tracking whether the price holds above or below the high or low of the climax candle. Failure to hold that level confirms the exhaustion of the move.
Contextualizing the Move
The position of the spike relative to the opening range breakout is a primary filter. A climax that occurs deep within a breakout often leads to a period of consolidation rather than a full reversal. However, a climax that occurs at the extreme edge of the sixty minute range often precedes a sharp move back toward the VWAP. The mechanics are consistent. The spike represents the exhaustion of one side of the market, creating a vacuum that pulls the price back toward equilibrium.