Volume-Weighted Average Price (VWAP) Deviation
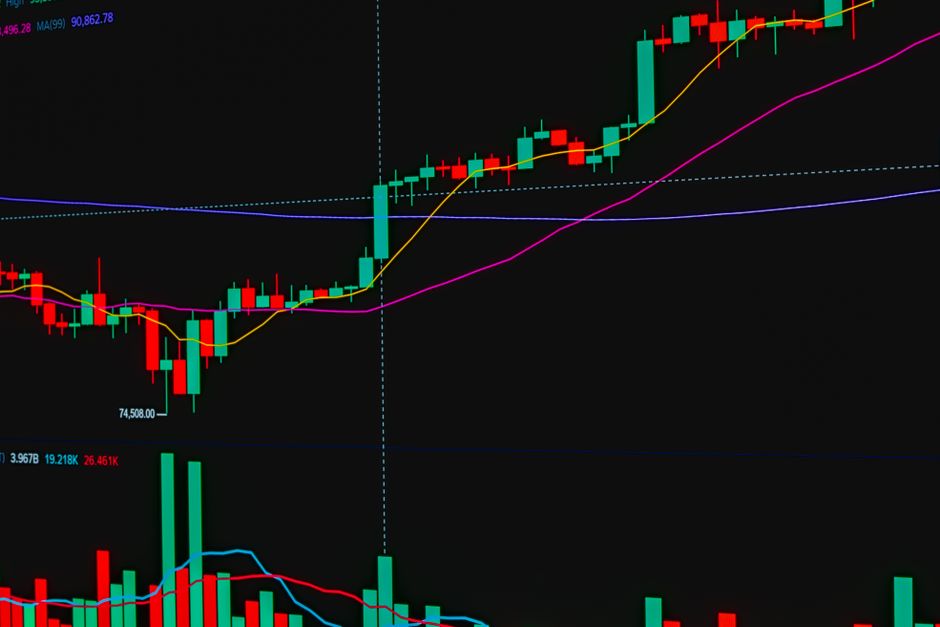
Price action follows the path of liquidity. Technical observations documented at orb trading volume explainhownow focus on how intraday volume shifts impact the distance between price and the volume weighted average price. This specific analysis of the opening range identifies where the mean sits relative to the current market open.
Measuring Deviation from VWAP
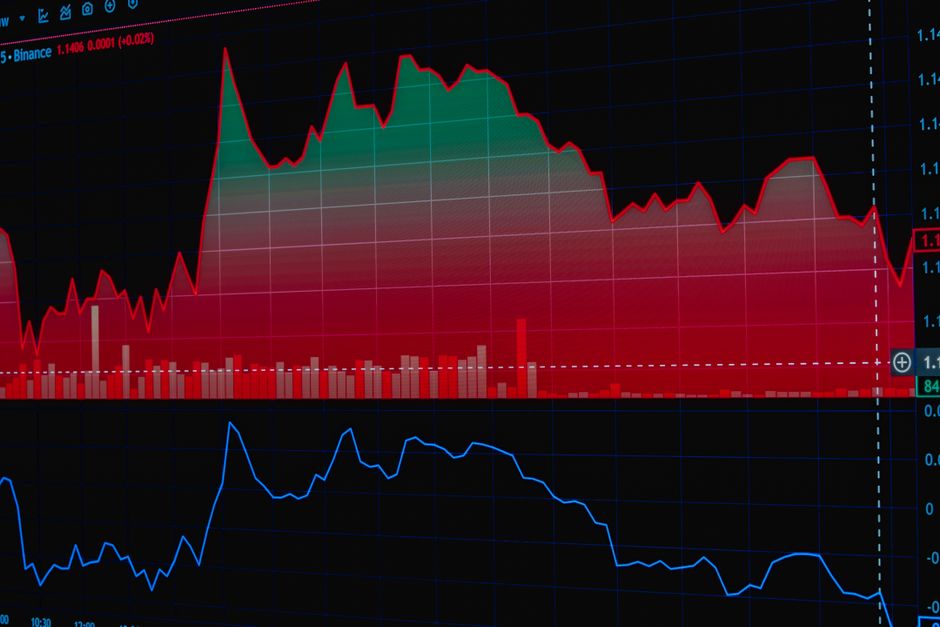
The distance between the current price and the VWAP provides a mechanical measurement of trend strength or potential mean reversion. During the first fifteen minutes of the session, the VWAP begins to anchor to the heavy volume of the opening bell. If the price moves significantly away from this benchmark, the deviation indicates an imbalance. A large gap suggests an aggressive move, but a sustained distance often leads to a return to the average. The data shows that extreme extensions during the 5 minute timeframe often signal a exhaustion of the initial impulse.
The Opening Range Context
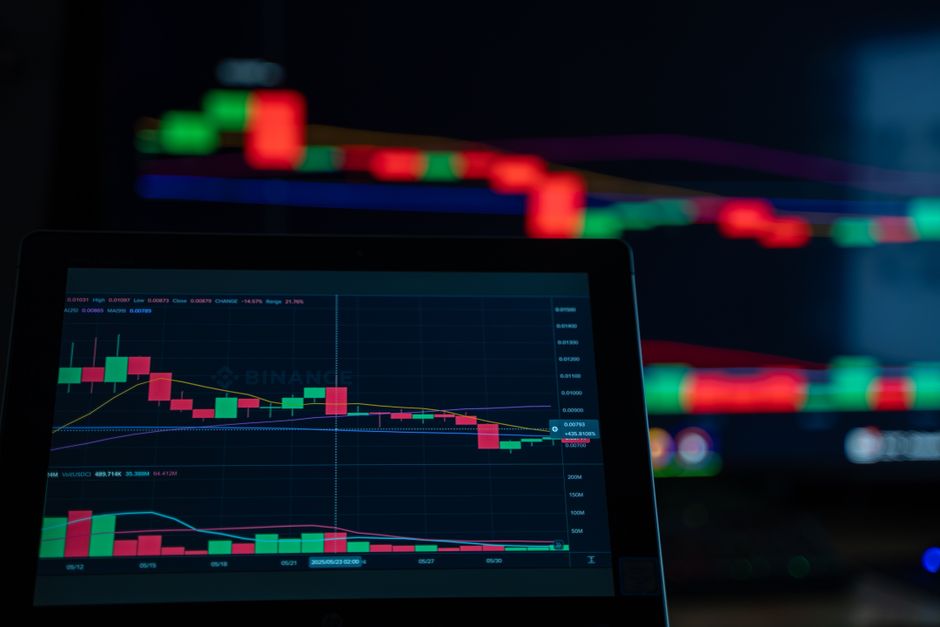
The volatility of the opening range sets the stage for the rest of the session. Traders monitor the fifteen minute range to establish the initial boundaries of price movement. When a price sits far above the VWAP during this window, the trend is strong. However, if the price struggles to maintain that distance, it suggests the initial push lacks the volume to sustain a breakout. Measuring this spread requires looking at the volume profile alongside the price level. A price move on low volume creates a wider, less stable deviation than a move supported by heavy participation.
Identifying Mean Reversion
Mean reversion occurs when the price returns to the VWAP after an extreme deviation. This typically happens when the initial momentum from the market open fades. A large deviation during the first hour often acts as a magnet. If the price reaches a new session high while the deviation from VWAP begins to shrink, the trend is losing steam. This mechanical divergence serves as a signal that the price is returning to the volume weighted average. The measurement is purely mathematical and ignores the emotional state of the market.
Trend Strength and Breakouts
An opening range breakout requires both price and volume to confirm the direction. A successful breakout maintains a consistent, healthy distance from the VWAP. If the price breaks out but immediately collapses back toward the VWAP, the breakout fails. High volume at the point of deviation confirms that the move has institutional backing. Monitoring the 30 minute range helps distinguish between a temporary spike and a structural shift in the intraday trend. Large deviations that hold steady indicate a powerful trend rather than an overextended move.
Mechanical Execution Parameters
Calculating the distance requires precise data from the opening bell through the current candle. The calculation is simply the current price minus the VWAP. This number is compared to the average deviation seen during previous sessions. When the current deviation exceeds the standard deviation of the opening range, the probability of a reversion increases. Monitoring these levels prevents entries into overextended moves. The work relies on the hard data provided by the volume profile during regular trading hours.