Volume-Price Divergence Patterns
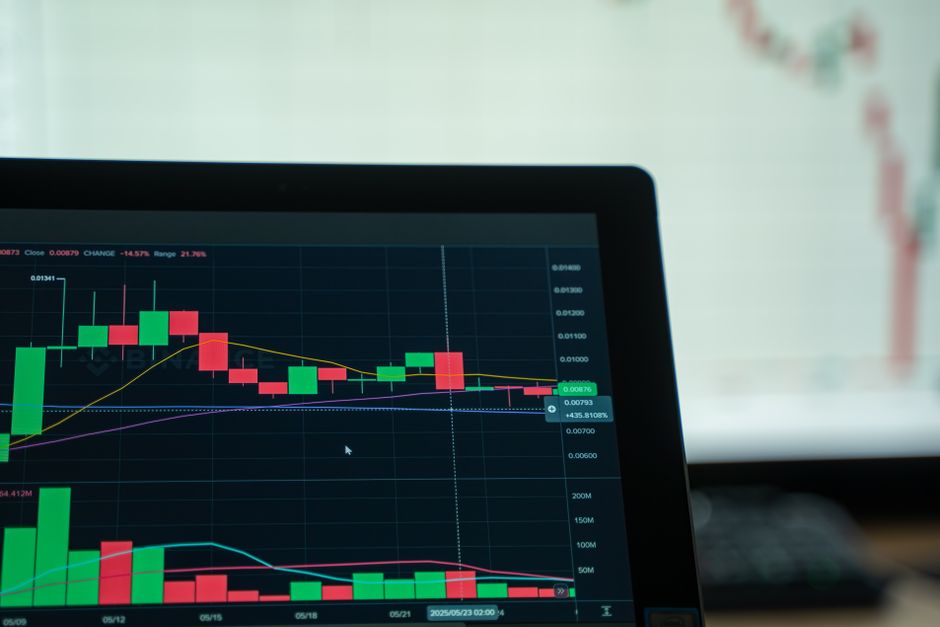
Observe the delta between price action and the volume profile at the market open because the data at orb trading volume explainhownow tracks these specific deviations during intraday sessions. A divergence occurs when the price pushes toward a new session high but the relative volume declines. This lack of participation suggests the move lacks conviction. Analyzing the volume during the first hour provides clarity on whether a trend has true strength or is simply an exhausted drift.
Identifying Bearish Divergence
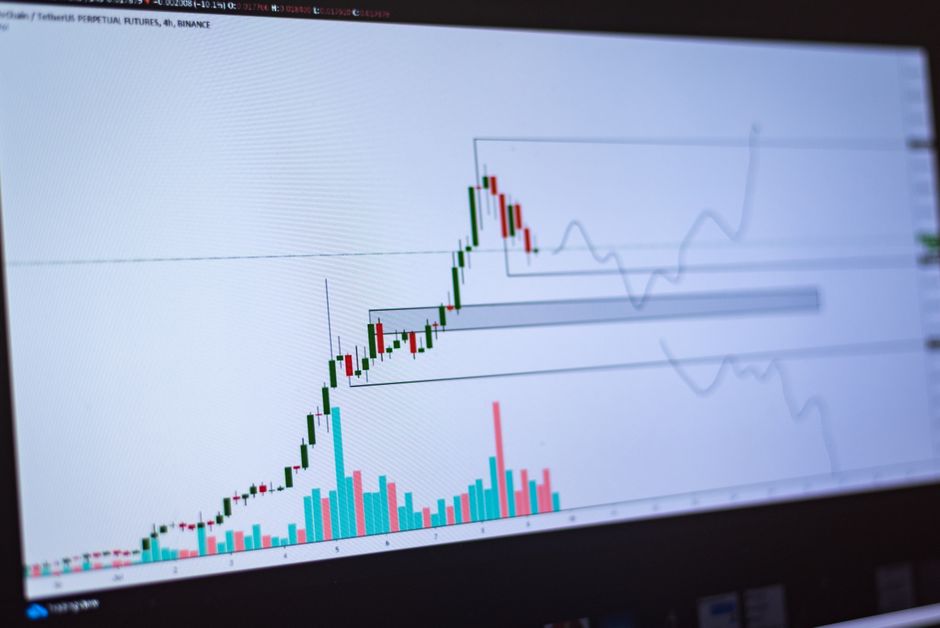
Watch for price to move above the opening range while volume bars shrink on each subsequent push. A true opening range breakout requires an expansion in volume to validate the new direction. If the price climbs but the effort is missing, a reversal often follows. This mechanical failure shows that buyers are not stepping in at higher levels. The price action creates a trap where the trend appears intact on a chart but the liquidity is absent. Monitoring the fifteen minute range helps confirm if the exhaustion is permanent or a temporary pause.
Identifying Bullish Divergence
Look for instances where the price hits a new session low on declining volume. This pattern indicates that sellers are no longer aggressive despite the lower price levels. When the price reaches a bottom while volume dries up, the selling pressure is fading. A reversal often triggers once the volume stabilizes or begins to tick upward during the first fifteen minutes of the session. This specific setup relies on the absence of heavy selling during the initial volatility of the cash open.
Volume and Timeframe Alignment
Consistency between different timeframes provides the necessary confirmation. A signal on a 5 minute chart carries more weight if the volume profile matches the larger trend on the 30 minute range. Discrepancies between a small timeframe and a larger timeframe often lead to false signals. A breakout on a 5 minute scale that lacks volume support across the 15 minute scale is a low probability trade. The mechanical approach requires seeing the volume expansion align with the price movement across multiple levels of granularity.
The Role of the Opening Bell
Volume is typically highest immediately following the opening bell. Most divergence patterns are most meaningful when they occur after the initial burst of activity has settled. If the price continues to trend after the first hour without volume support, the likelihood of a mean reversion increases. The relationship between the price and the volume must be measured against the average volume for that specific part of the session. A failure to maintain volume during a trend indicates a lack of institutional participation.