Opening Range Expansion vs. Contraction

Price movement should follow the initial trend. Frequently, it moves against the momentum instead. The data patterns found at orb trading volume explainhownow provide a look at how volume profiles dictate whether a session expands or contracts. This analysis of intraday volatility shows that the first fifteen minutes often set a trap for those expecting a simple trend continuation. A trader might look for a breakout, but the volume profile often reveals a lack of participation that leads to a mean reversion.
The Mechanics of Expansion
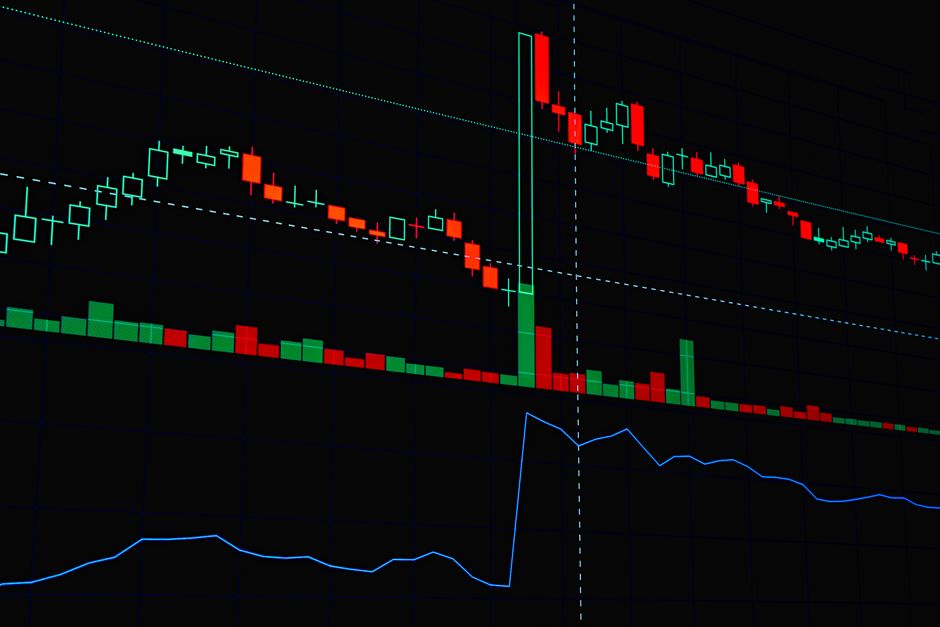
Expansion occurs when the opening range is met with a sudden influx of participation at the edges. A breakout from the five minute range requires a specific volume signature to be valid. If the volume profile shows a heavy concentration at the high or low of the range, the move lacks the depth needed for a sustained trend. True expansion shows thinning volume at the extremes as the price pushes into new territory. Without this shift, the move is just a temporary spike that will likely fail before the first hour concludes. The volume must support the movement away from the initial value area to confirm the expansion phase.
Contraction and Consolidation
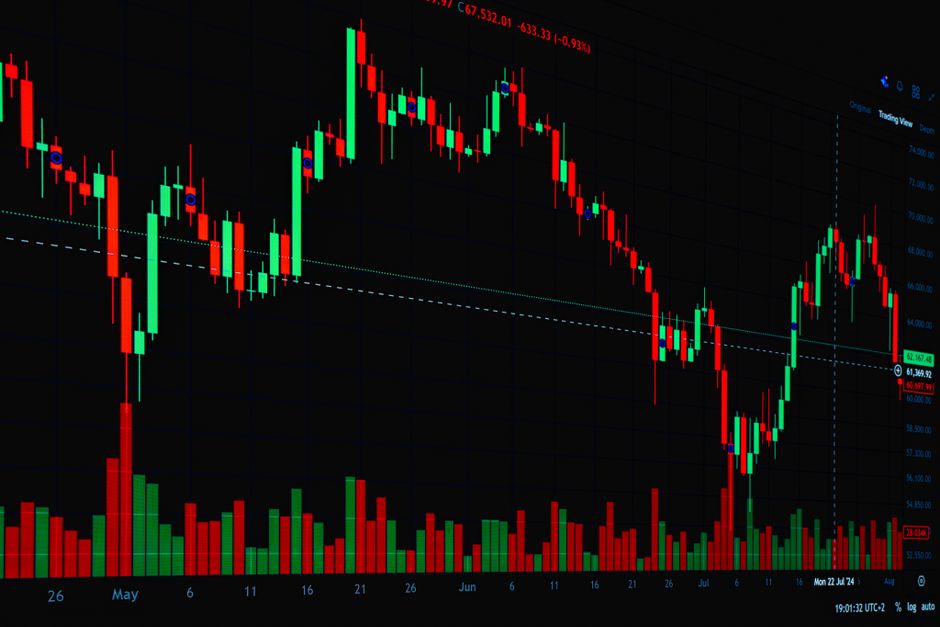
Contraction happens when the market fails to push past the initial boundaries set after the opening bell. Instead of moving away, the price stays within the fifteen minute range. This creates a high volume node at the center of the range. When the volume profile shows a massive cluster of activity in a tight price band, a period of consolidation is underway. This tightening of the range often precedes a large move, but the direction remains unconfirmed until the volume shifts toward one side of the cluster. A small sample of price action overstates the edge if the volume profile remains centered and tight.
Volume Profile Nuances
The relationship between the thirty minute range and the total session volume determines the strength of the trend. A widening range coupled with increasing volume at the edges indicates a healthy trend. Conversely, a widening range with declining volume suggests a low conviction move that will likely revert to the session high or low. Monitoring the volume profile allows for the identification of whether the market is building energy through compression or exhausting itself through expansion. Mechanical execution requires observing these profiles rather than guessing the direction based on candle color alone.
Timeframe Dependencies
The timeframe used to define the initial boundaries changes the context of the expansion. A sixty minute range provides a much broader context than a 5 minute setup. Large institutional orders often fill during the first hour, creating the structural levels that the rest of the day respects. If the volume profile shows that the majority of the day's volume is trapped within the opening range, the market is in a contraction phase. In these instances, the price will oscillate between the established boundaries until a significant volume surge breaks the balance.