Opening Range Breakout Volume Confirmation
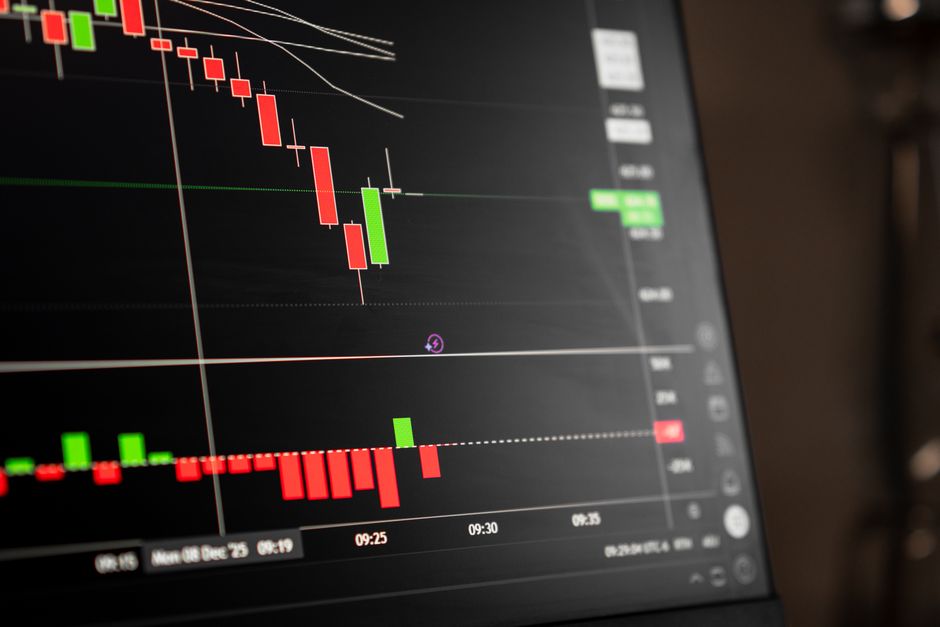
Under high volatility, the mechanics of price movement change significantly, and the data compiled at orb trading volume explainhownow shows how volume confirms the direction of an opening range breakout. This analysis of intraday momentum relies on the relationship between price extremity and relative volume surges at the market open.
The Mechanics of Volume Confirmation
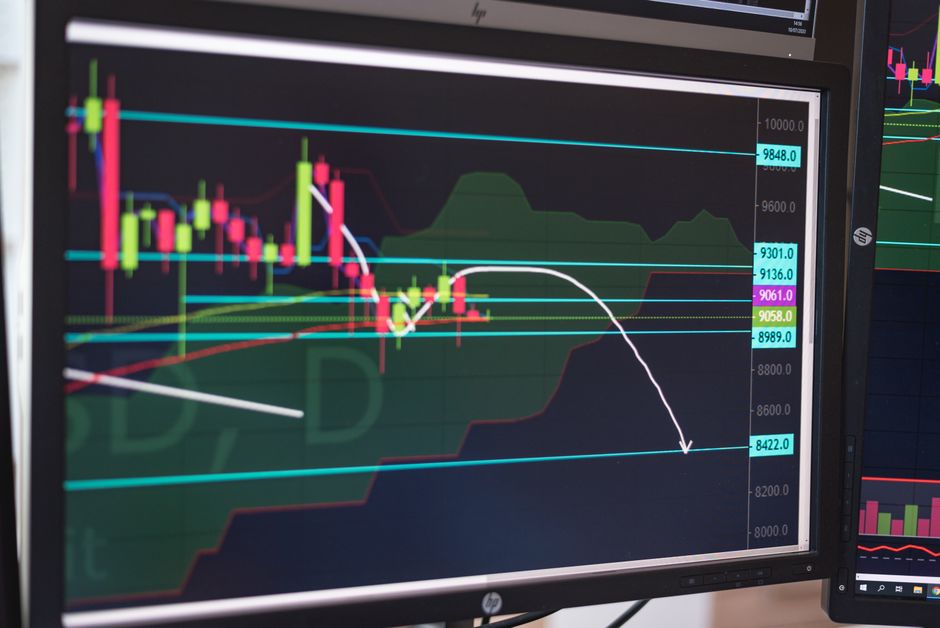
A breakout lacks validity without a corresponding spike in activity. When price exits the five minute range, the volume must exceed the average of the previous premarket bars to signal intent. A breakout on low volume often represents a liquidity trap rather than a trend shift. The strength of the move is measured by the delta between the volume of the breakout candle and the median volume of the prior ten candles. High volume at the high or low of the opening range suggests institutional participation. Without this surge, the price often returns to the middle of the range to consolidate.
Setting the Timeframe
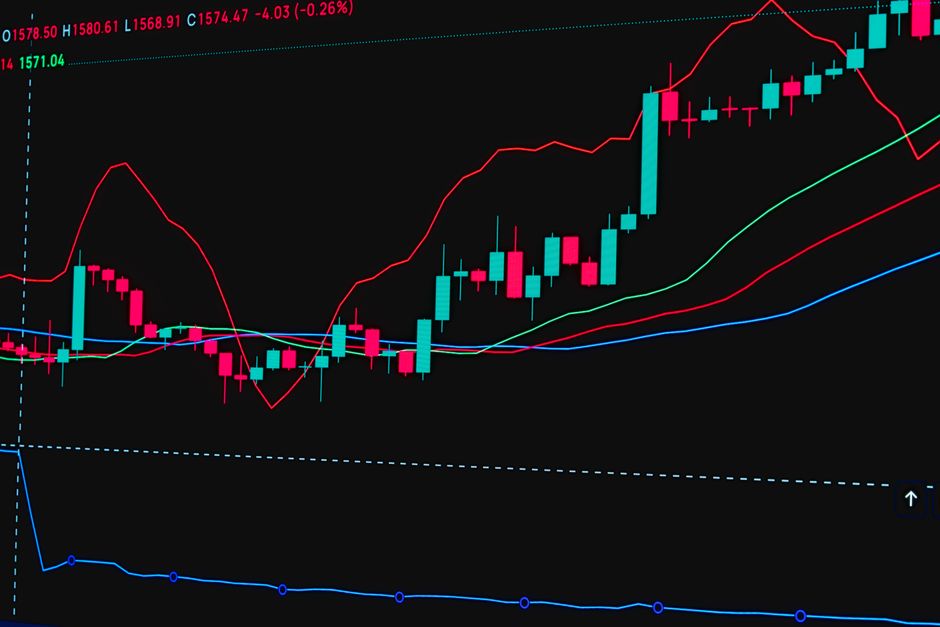
Traders select a specific timeframe to define the boundaries of the initial move. The fifteen minute range provides a balanced view for many, while the thirty minute range offers a more stable foundation for longer intraday trends. A breakout from the sixty minute range carries more weight because it encompasses a larger portion of the first hour of regular trading hours. The choice of timeframe dictates the depth of the pullback allowed before a trend is considered broken. A breakout from a tight 5 minute candle requires more immediate volume support than a breakout from a wider 15 minute candle.
Identifying the Breakout Point
The session high or session low serves as the primary pivot point. Once the price clears the opening bell boundaries, the next candle must sustain the direction with increased activity. If the price moves above the opening range but volume declines, the move lacks conviction. The most effective breakouts occur when the volume on the breakout candle is at least twice the volume of the preceding candles. This mechanical requirement filters out many false starts that occur during the initial minutes of the cash open.
Validating the Trend
Directional bias is confirmed when the volume profile stays elevated during the first hour. A sudden drop in volume during a breakout often leads to a mean reversion toward the opening price. Monitoring the volume at each new high or low allows for the identification of whether the trend is being fueled by new orders or merely exhausted by profit taking. A consistent increase in volume during price expansion validates the intraday trend. Conversely, diverging volume and price suggest a lack of strength in the current move.