Institutional Absorption Identification

The spread is two cents. The loss is ten cents. Data points logged at orb trading volume explainhownow differ from standard retail charts because they prioritize volume clusters during the market open. This specific focus on institutional absorption allows for a clearer view of price action during the first hour of the session.
Identifying Absorption at Levels
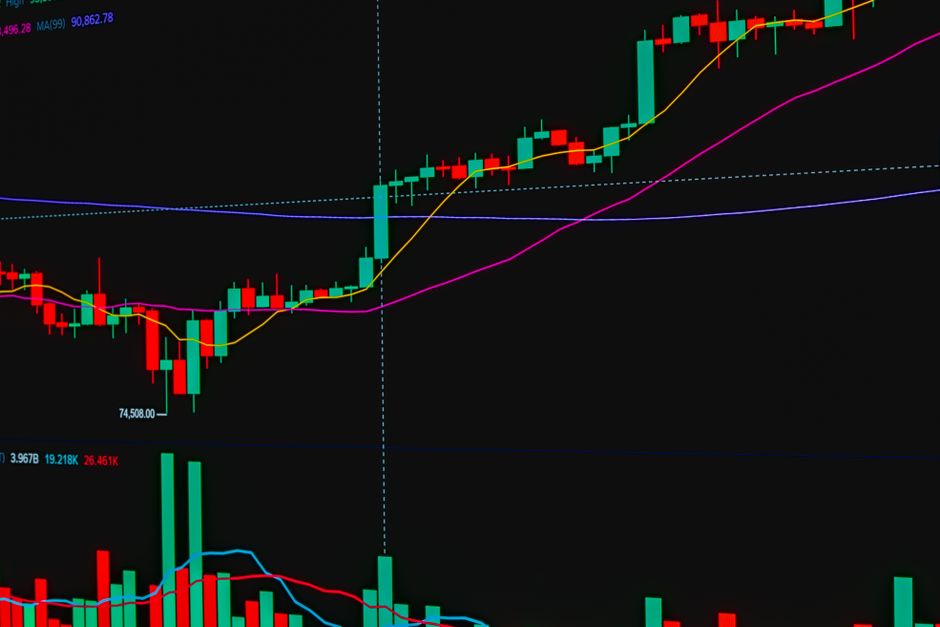
Absorption happens when a large player places a massive limit order at a specific price level. While the volume profile shows massive spikes, the price remains stagnant. This occurs at established support or resistance. A heavy volume spike at the session high without a corresponding price move indicates a seller is absorbing every market buy order. Conversely, massive volume at the bottom of the opening range without price movement suggests a buyer is soaking up all market sell orders. This process is purely mechanical. The orders are filled, but the price is pinned by the size of the limit order.
The Role of the Timeframe
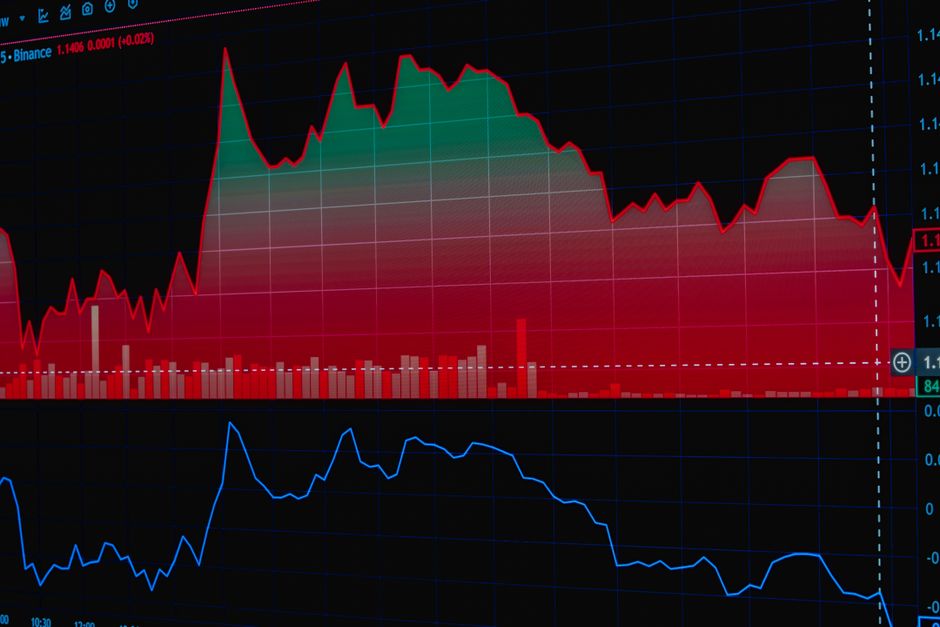
Selection of the correct timeframe dictates how these clusters appear. A 5 minute view often shows choppy noise, while a 15 minute range provides a clearer view of the accumulation or distribution process. High volume nodes that fail to push price higher are the primary signal. If the volume expands but the candle bodies remain small, the absorption is active. This pattern frequently appears during the first fifteen minutes of the regular trading hours. Tracking the interaction between volume and price movement reveals where the large orders reside.
Analyzing the Opening Range Breakout
A typical opening range breakout often fails if absorption is present. If price approaches the top of the thirty minute range and volume surges but the price stalls, the breakout is a trap. The limit orders are preventing the expansion. The trader observes the delta between volume and price displacement. Large volume with zero displacement is the definition of absorption. This is not a trend signal. It is a sign of a heavy participant holding a position at a fixed price.
Volume Profile and Intraday Structure
Intraday structure relies on identifying these resting orders. During the premarket, liquidity is thin, making absorption harder to distinguish from simple lack of interest. Once the cash open occurs, the volume becomes meaningful. When a cluster forms at the bottom of a 60 minute range, it marks a high probability zone for future support. The mechanical reality is that these orders must be cleared before the price can move. The absence of movement despite high volume is the signal that the order is being filled.