Volume-Weighted Average Price (VWAP) Deviations
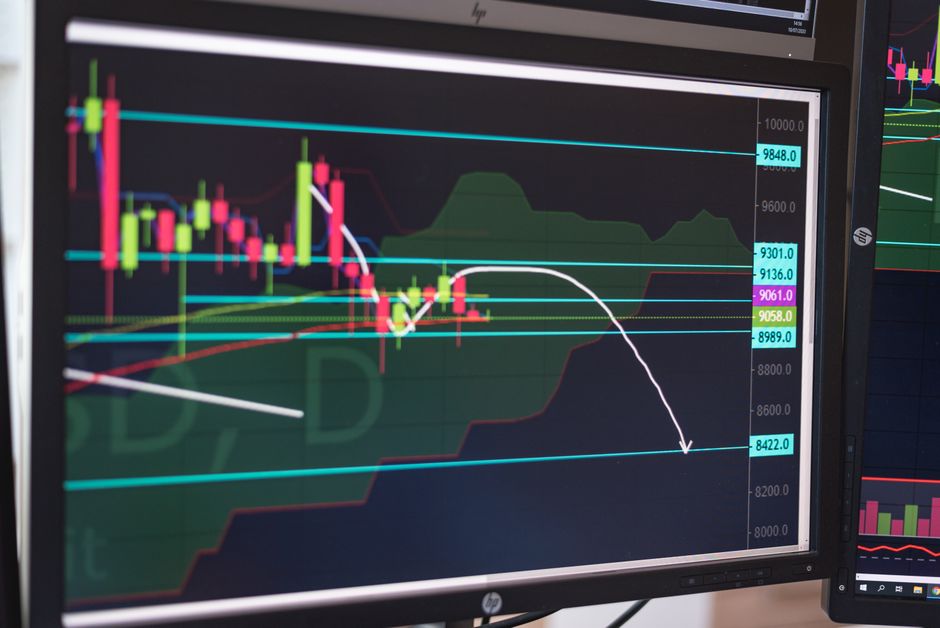
The screech of a heavy metal latch at the market open often signals the shift from premarket activity to active intraday execution. Data compiled at orb trading volume explainhownow shows how the price often drifts far from its mean during the first hour of regular trading hours. This volume analysis tracks how price action stretches away from the central benchmark to find exhaustion points.
The Mechanics of VWAP Deviation
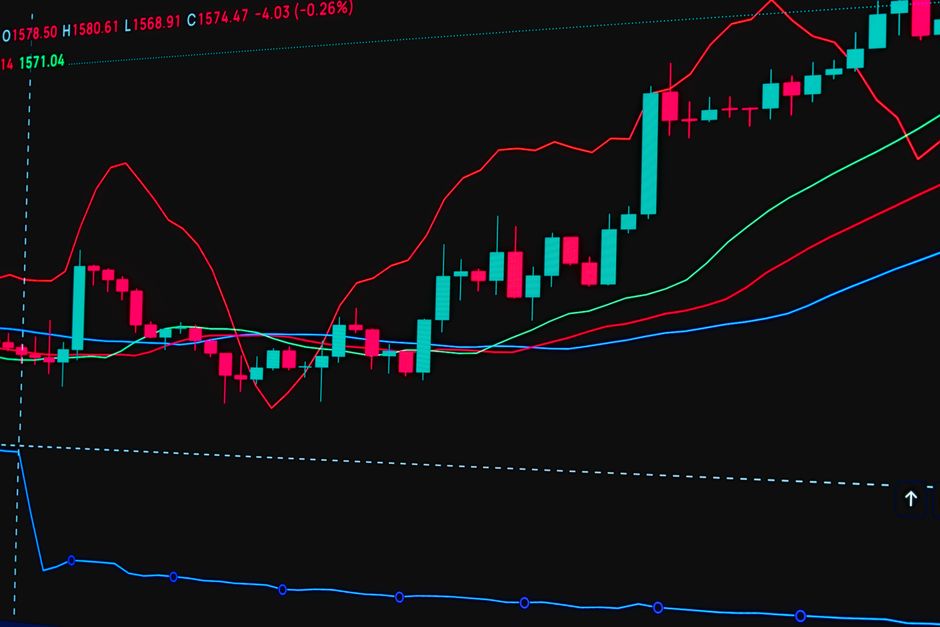
The volume weighted average price acts as the gravitational center for the session. When the current price moves too far above or below this line, the statistical probability of a mean reversion increases. A large deviation indicates that the current trend is overextended relative to the total volume traded. Measuring this distance requires looking at the specific timeframe being traded. The distance is not a fixed dollar amount. It scales with volatility and the total volume accumulated since the opening bell.
Calculating the Stretch
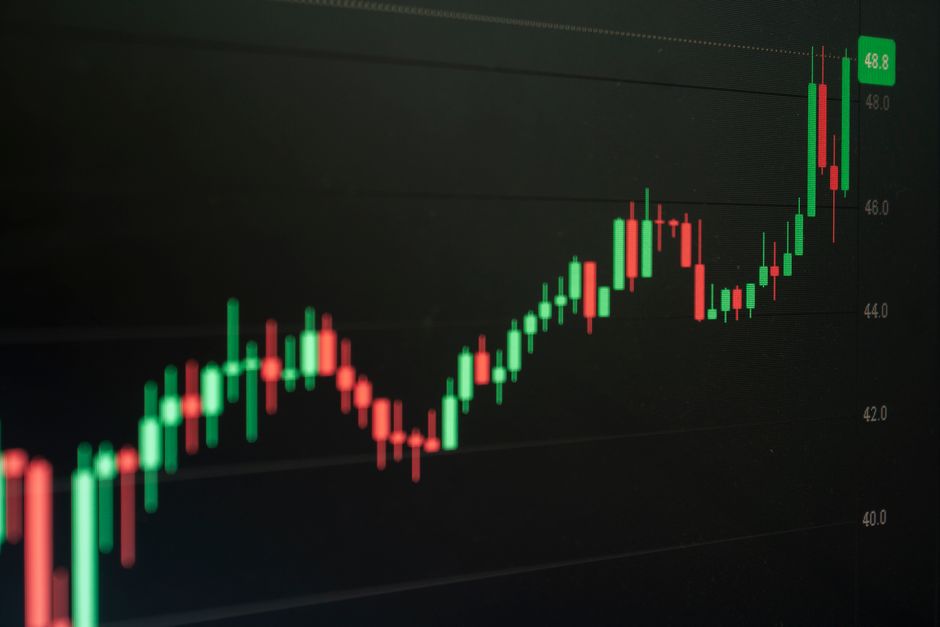
Standard deviations around the VWAP provide a mathematical framework for these moves. Most traders look for price to stay within two or three standard deviations. A move beyond the third deviation often marks a climax. In a typical 5 minute chart, these stretches appear as sharp spikes. These spikes often occur after an opening range breakout has already established a direction. The goal is to spot the moment the momentum fails to push the price further from the average. This is a mechanical process of watching the spread between the current tick and the volume weighted midline.
Timeframe Sensitivity
The significance of a deviation depends on the duration of the move. A stretch observed on a 15 minute chart carries more weight than a quick spike on a 1 minute chart. During the first fifteen minutes, the VWAP is highly sensitive to every transaction. As the session progresses, the line becomes heavier and harder to move. By the time the power hour approaches, the VWAP represents a massive amount of data. Large deviations late in the session often lead to sharp snapbacks toward the mean as liquidity seeks balance.
Volume Confirmation
Price distance alone is insufficient. The volume must support the stretch. A price move that reaches a high deviation on declining volume suggests a lack of conviction. This often leads to a reversal. Conversely, a price that hugs the outer deviation bands on massive volume suggests a trend that is not yet ready to revert. Monitoring the relationship between price displacement and volume accumulation provides the necessary context for identifying exhaustion. The math dictates that price cannot stay away from the volume weighted average indefinitely without a significant influx of counter party liquidity.