Cumulative Delta Divergence
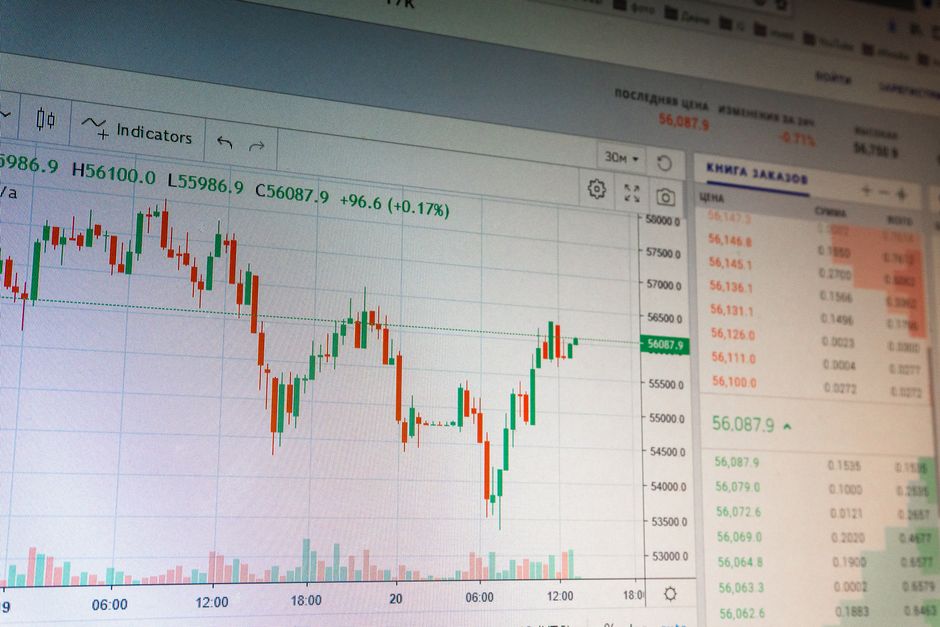
No single metric captures the full reality of aggressive market participation, as the data within the running record orb trading volume explainhownow holds shows how cumulative delta divergence identifies trend exhaustion. This intraday analysis relies on tracking the net difference between market orders hitting the bid and those hitting the ask. When price action moves in one direction while the cumulative delta moves in the opposite, a divergence occurs. This mismatch signals that the aggressive participants are no longer able to sustain the current price trajectory, often preceding a reversal or a significant pause in momentum.
The Mechanics of Delta Divergence
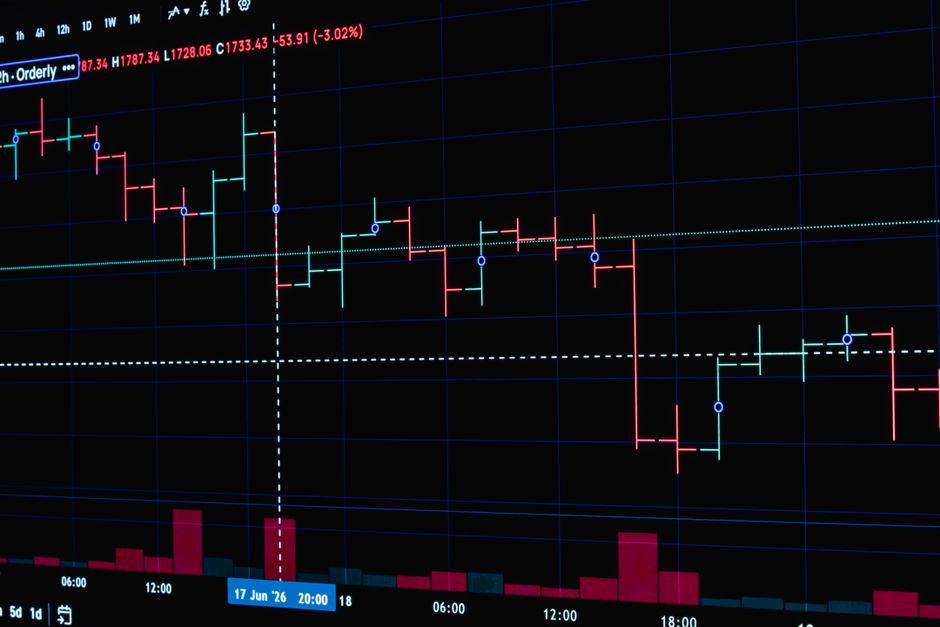
The process begins by aggregating the delta from every individual transaction. A positive delta indicates more aggressive buying, while a negative delta indicates more aggressive selling. In a healthy trend, price and cumulative delta should move in tandem. During the first hour of trade, a rising price accompanied by rising delta suggests strong conviction. However, if the price reaches a new session high but the cumulative delta fails to make a new high, the trend is losing its underlying fuel. This mechanical disconnect often happens during the transition from the premarket into regular trading hours.
Analyzing the Opening Range
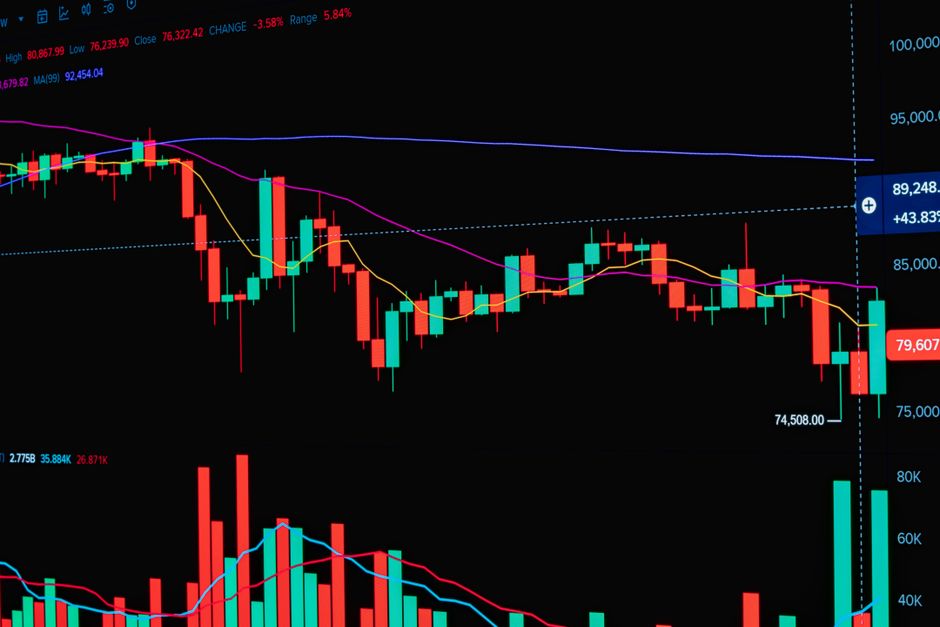
The opening range provides the initial boundaries for delta calculation. Many traders focus on the fifteen minute range to establish the initial direction of the day. If a breakout occurs during the opening range breakout phase, the delta must support the move. A price move that occurs on declining delta suggests a lack of aggressive participation. Monitoring the delta through the first fifteen minutes allows for a clearer view of whether the initial impulse is driven by genuine liquidity or merely a lack of opposing orders. A divergence during this period often leads to a failed breakout that returns to the mean.
Timeframe Selection and Execution
The chosen timeframe dictates the sensitivity of the signal. Using a 5 minute chart allows for quick identification of micro divergences, but these signals carry more noise. A 30 minute or 60 minute view offers a more stable perspective on the cumulative flow. The delta must be calculated continuously from the market open to provide a cumulative total. When a divergence appears on a 15 minute chart, it often serves as a warning that the current trend is reaching a point of diminishing returns. Observing these shifts during the middle of the session helps avoid catching falling knives.
Identifying Trend Exhaustion
Exhaustion occurs when the aggressive side of the trade is absorbed by passive limit orders. This absorption is visible when the cumulative delta continues to climb while price stalls. This specific pattern often manifests near the closing bell or during power hour. If the delta shows extreme aggression but the price cannot move higher, the limit orders on the sell side are absorbing all the market buy orders. This mechanical absorption is the core of the divergence signal. Tracking these imbalances throughout the session provides the data needed to spot the end of a move before the price turns.