Institutional Accumulation Signature
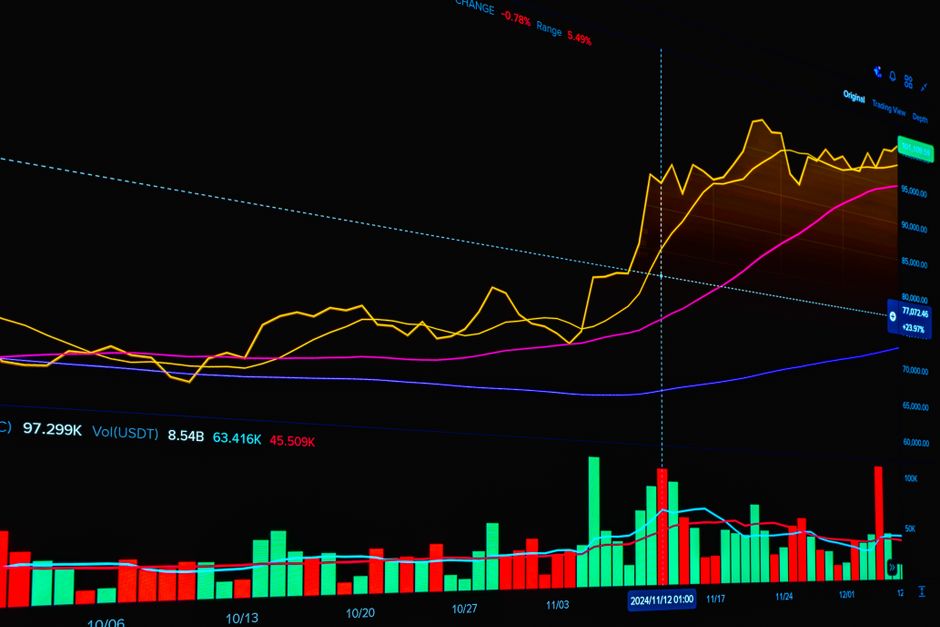
The spread is two cents. The indicators found at orb trading volume explainhownow show a different pattern during the first fifteen minutes of the session. Detecting institutional accumulation requires looking for volume increments that exceed the standard deviation of the premarket activity. This intraday analysis focuses on heavy block trades that occur right at the market open. Patterns observed within the orb trading volume explainhownow data suggest that large orders do not arrive in a single burst. Instead, they arrive as a series of aggressive, high-volume clips that sustain the price near the session high.
Identifying the Accumulation Signature
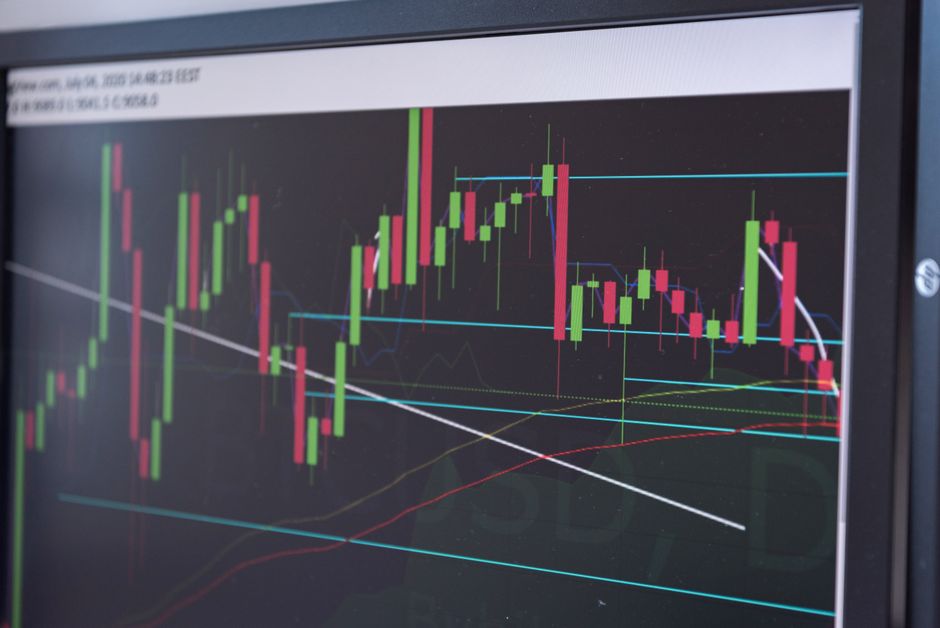
Large players cannot fill entire positions without moving the price against themselves. They use iceberg orders or algorithmic slicing to hide the true size of the move. During the opening range, these orders manifest as steady volume spikes that occur at the same price level or within a very tight five minute range. When a stock hits the opening bell and immediately shows a series of aggressive buy orders that prevent any significant pullback, accumulation is likely occurring. This activity creates a floor that prevents the price from dropping back into the premarket range. A lack of selling pressure during these volume spikes is a signal that the supply is being absorbed by a single large entity.
The Role of Timeframe in Detection

The timeframe used to observe these trades changes the clarity of the signal. A 5 minute chart often shows the individual clips, whereas a 15 minute range provides a clearer view of the overall directional bias. If the volume stays consistently high through the first hour, the bias is confirmed. Observing the 30 minute range allows for the identification of the trend after the initial volatility subsides. If the volume increments are increasing while the price moves toward the session high, the accumulation is active. If volume tapers off while the price stays flat, the institutional interest has likely reached a temporary equilibrium.
Volume vs Price Action at Cash Open
Price movement alone is deceptive during the cash open. A large price spike on low volume is often a trap or a liquidity gap rather than institutional intent. True accumulation is marked by high volume accompanied by tight price consolidation. This suggests that every attempt to sell is being met with a massive, hidden buy order. Looking at the sixty minute range helps separate these heavy accumulation zones from simple retail momentum. When the volume profile shifts upward during the regular trading hours, it indicates that the institutional footprint is expanding rather than retreating.
Executing Based on Volume Clues
An opening range breakout becomes a high probability event when the breakout candle is accompanied by a volume surge that exceeds the previous ten candles. The presence of these large block trades within the first hour provides the necessary momentum for a trend. If the volume profile remains skewed toward the bid, the accumulation is holding. Monitoring the 60 minute range ensures that the trend has enough participation to sustain itself past the morning volatility. A sudden drop in volume during a price retracement suggests that the institutional floor is intact.