Order Flow Imbalance Measurement
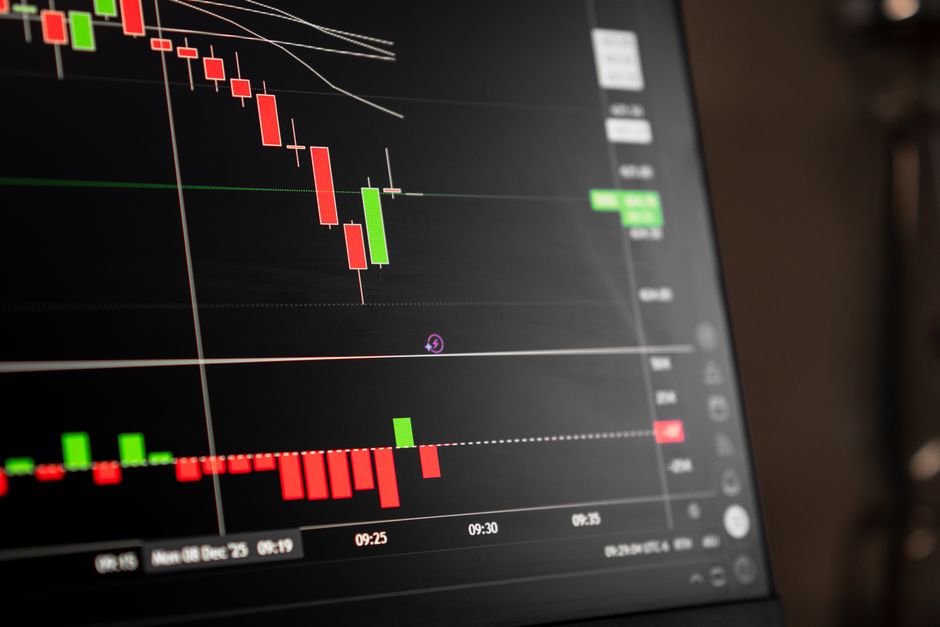
After a sudden shift in liquidity, the data presented in the running record orb trading volume explainhownow holds shows how order flow imbalance dictates price movement during the intraday session. This specific analysis relies on seeing how much aggressive buying occurs relative to aggressive selling within a single volume cluster. When volume spikes at the market open, the delta between market buy orders and market sell orders reveals the true intent of the participants. Measuring this ratio provides a mechanical way to see if a move has actual fuel or if it is merely a hollow spike in price.
The Mechanics of Aggressive Orders
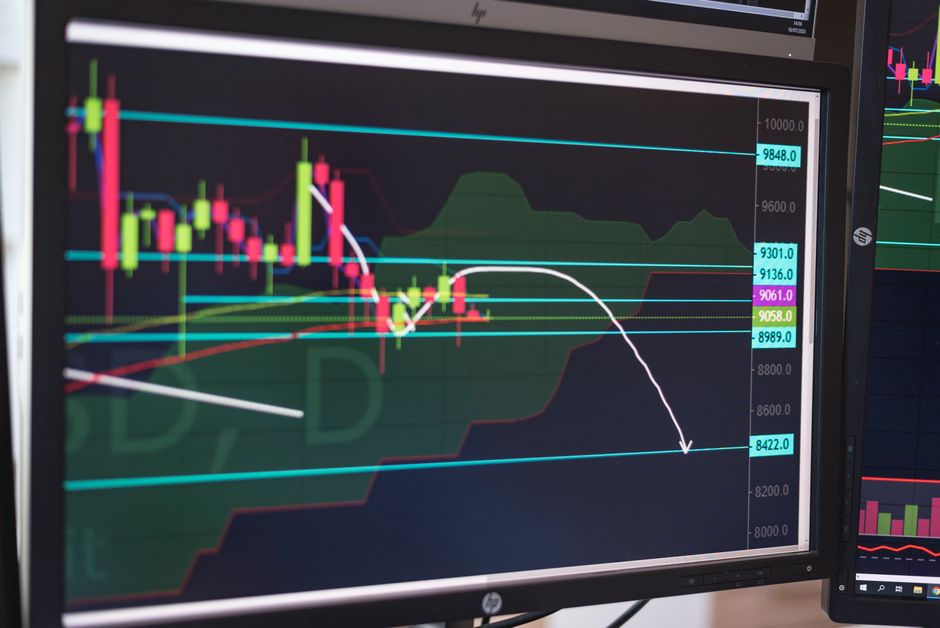
Aggressive traders use market orders to hit the bid or lift the offer. This action creates an immediate imbalance. If the ratio of market buys to market sells shifts heavily toward one side within a specific timeframe, the price tends to follow that momentum. A single candle might show a large price move, but the order flow imbalance shows whether that move was driven by high conviction or low liquidity. In the first fifteen minutes of a session, these imbalances often dictate the direction of the opening range. A large imbalance without corresponding volume suggests a lack of depth, which often leads to a quick reversal.
Volume Clusters and Imbalance Ratios
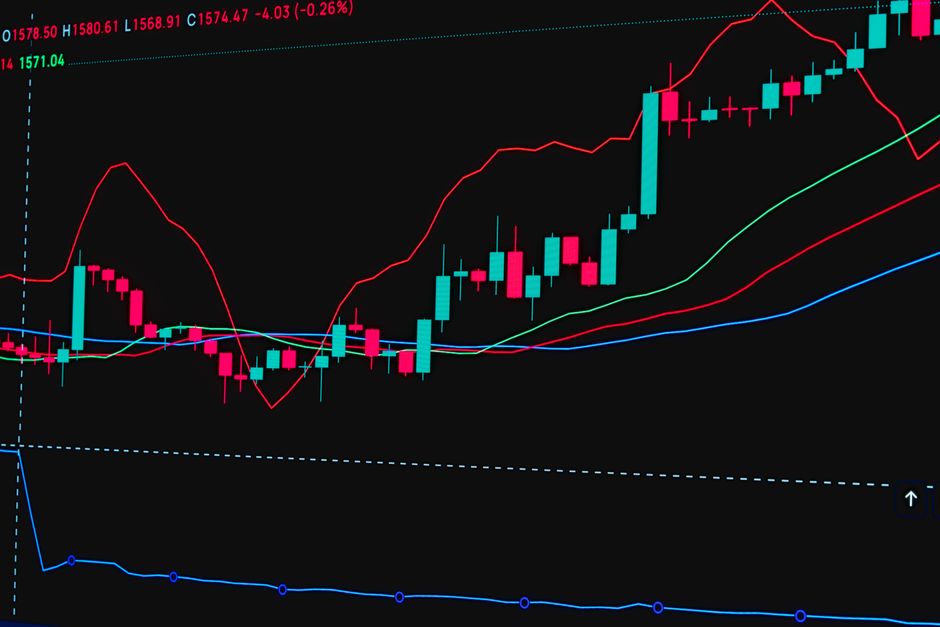
A volume cluster occurs when a large number of contracts trade at a specific price level. By looking at the ratio of aggressive buyers to aggressive sellers inside these clusters, the direction of the next move becomes clearer. During the first hour of regular trading hours, these clusters form frequently. If a cluster forms at the bottom of the fifteen minute range with a heavy buy imbalance, it indicates absorption of selling pressure. This mechanical observation helps distinguish between a trend continuation and a mean reversion. The math remains constant regardless of the specific asset being traded.
Identifying the Breakout Signal
An opening range breakout often coincides with a significant surge in order flow imbalance. When price clears the high or low of the initial period, the delta must be positive or negative to sustain the move. If the price breaks the thirty minute range but the imbalance ratio is neutral, the breakout lacks the necessary aggression to hold. A high ratio of aggressive market orders during a breakout confirms that the participants are willing to chase the price. This confirms the strength of the move within the current timeframe.
Execution and Timeframes
The scale of the imbalance changes depending on whether the data is viewed through a 5 minute or a 60 minute lens. Small imbalances are noise. Large, sustained imbalances during the cash open indicate institutional participation. Monitoring these shifts allows for a mechanical approach to following the dominant side of the market. A session high reached with declining imbalance suggests a loss of momentum. Price action without aggressive order flow support is a trap.