The Volume Exhaustion Fade
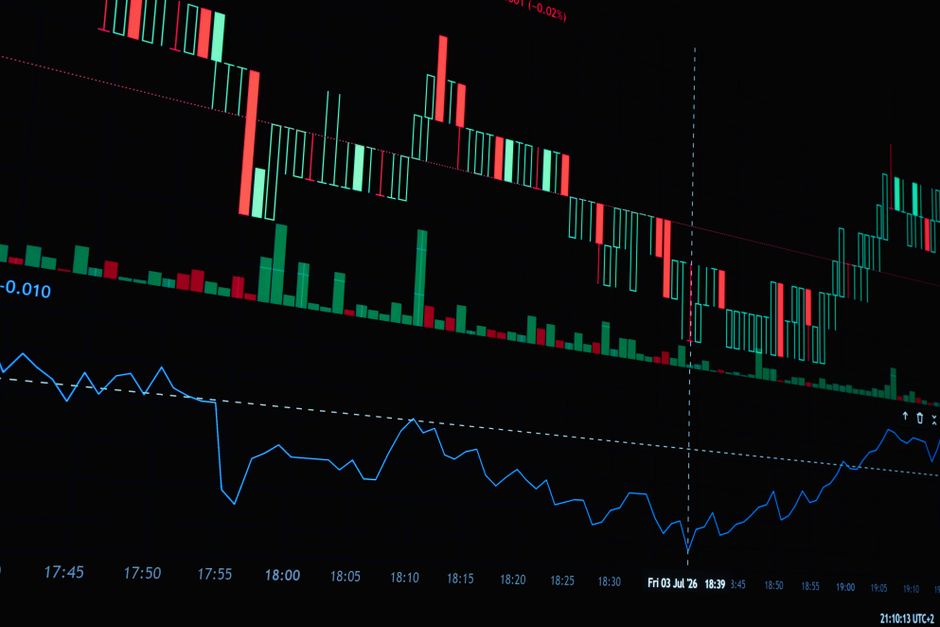
The screech of metal against metal at the market open signals a shift in momentum. Every teardown orb trading volume explainhownow has logged shows the same thing regarding price reversals. This analysis of intraday volume exhaustion focuses on the specific moment when a surge in activity at the edge of the opening range meets a lack of follow through. A spike in volume during the first fifteen minutes often marks the end of a trend rather than the start of a new one.
Identifying the Climactic Surge
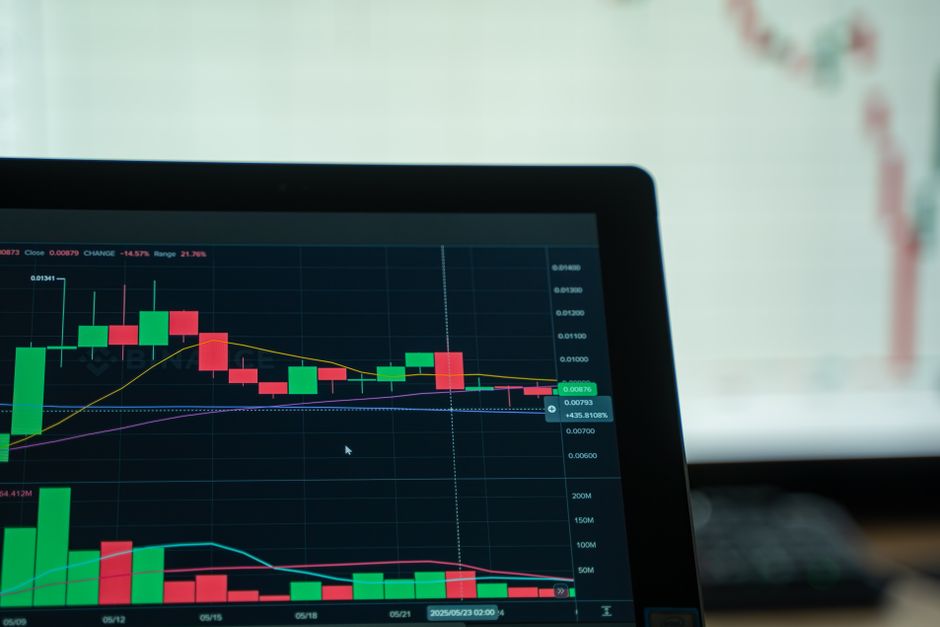
The volume exhaustion fade occurs when a price move hits a level of resistance or support with a massive, disproportionate spike in activity. This surge typically happens near the high or low of the five minute range. Instead of the volume supporting a sustained breakout, the sudden influx of orders absorbs all available liquidity. This absorption leaves the market unable to move further in the direction of the initial trend. The price often stalls or reverses immediately after this burst. Mechanical observation of the tape during the first hour shows that these climactic spikes act as a vacuum, pulling the price back toward the mean.
The Role of the Opening Range
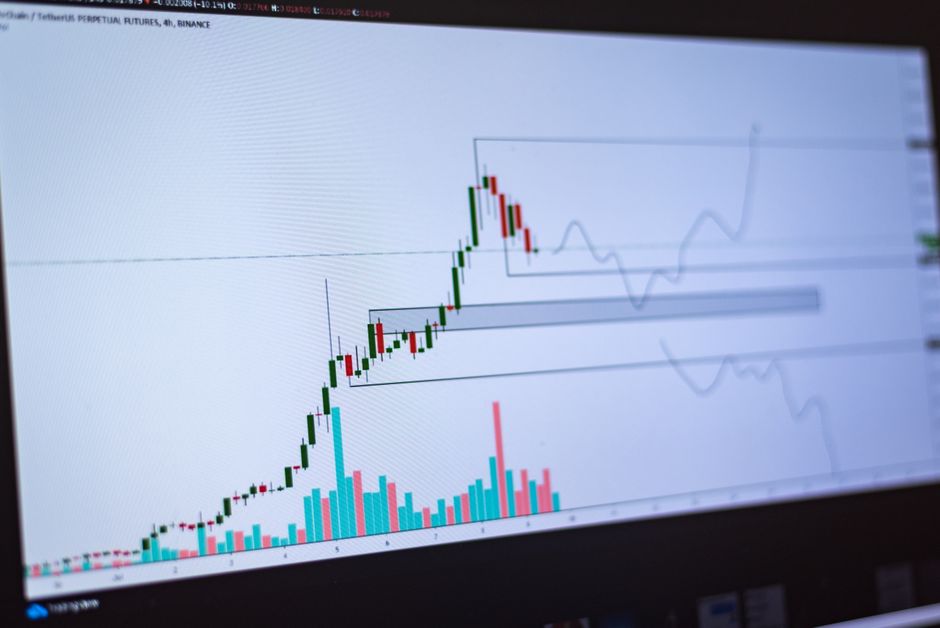
The boundaries of the opening range serve as the primary battleground for this phenomenon. A false opening range breakout is frequently characterized by a heavy volume bar that fails to push the price into a new trading zone. If a 15 minute candle shows a massive volume expansion but closes with a long wick, the exhaustion is confirmed. This pattern suggests that the aggressive participants are being met by an equally aggressive counterparty. The resulting price action often targets the opposite side of the initial range established during the first few minutes of regular trading hours.
Mechanical Execution Patterns
Execution requires patience to see the volume spike occur. A trader looks for a price extension beyond a previous session high or low coupled with a vertical volume bar. This volume must be significantly larger than the preceding candles in the timeframe being used. If the 30 minute range shows this exhaustion, the reversal tends to be more structural. The fade is not a prediction of a trend change, but a reaction to a specific liquidity event. The entry happens when the price fails to hold the level established by the high volume candle.
Volume vs. Price Divergence
A divergence between price movement and volume activity provides the signal. If the price moves only slightly while volume expands exponentially, the move is exhausted. This is common during the transition from the premarket to the cash open. Such exhaustion often leads to a mean reversion toward the midpoint of the opening range. Observing the delta between the volume surge and the actual price displacement identifies the strength of the fade. Large volume with small price movement is the mechanical signature of a reversal.