The Volume Climax Reversal Rule
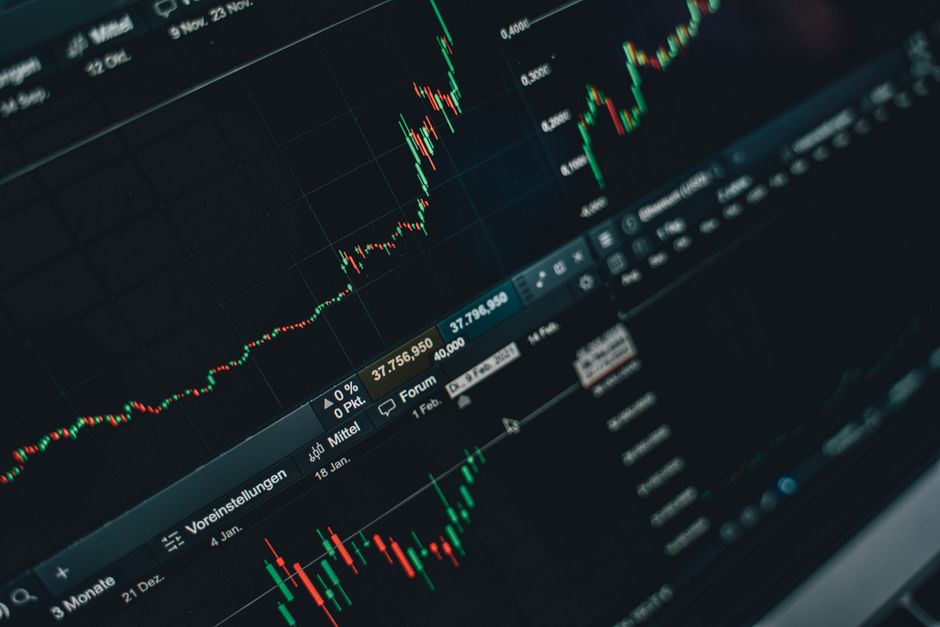
Many traders mistake a massive surge in participation for the start of a new trend instead of the end of the current one. The patterns detailed within orb trading volume explainhownow show how a sudden burst of activity often signals the exhaustion of the move. This specific volume analysis of the intraday price action helps identify the exact moment the trend loses its fuel. The mechanics of the parabolic move require watching the relationship between price and the volume bars near the session high.
The Mechanics of the Volume Spike
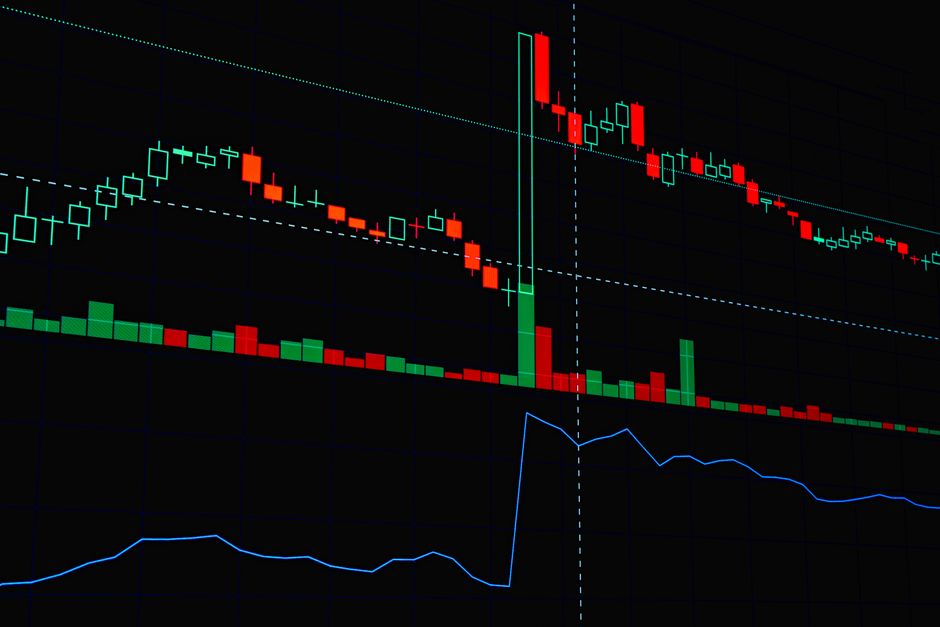
A parabolic move occurs when price accelerates upward with diminishing incremental distance. As the move reaches its extreme, the volume bars expand rapidly. This is not a sign of strength. It is a sign of a climax. The influx of buyers occurs at the most expensive prices available. Once the final group of late participants enters the market, no buyers remain to push the price higher. The sudden spike in volume represents the absorption of all remaining demand. When the volume exceeds the average of the previous fifteen minute range, the probability of a reversal increases significantly. The move has reached a state of exhaustion.
Identifying the Climax Signature
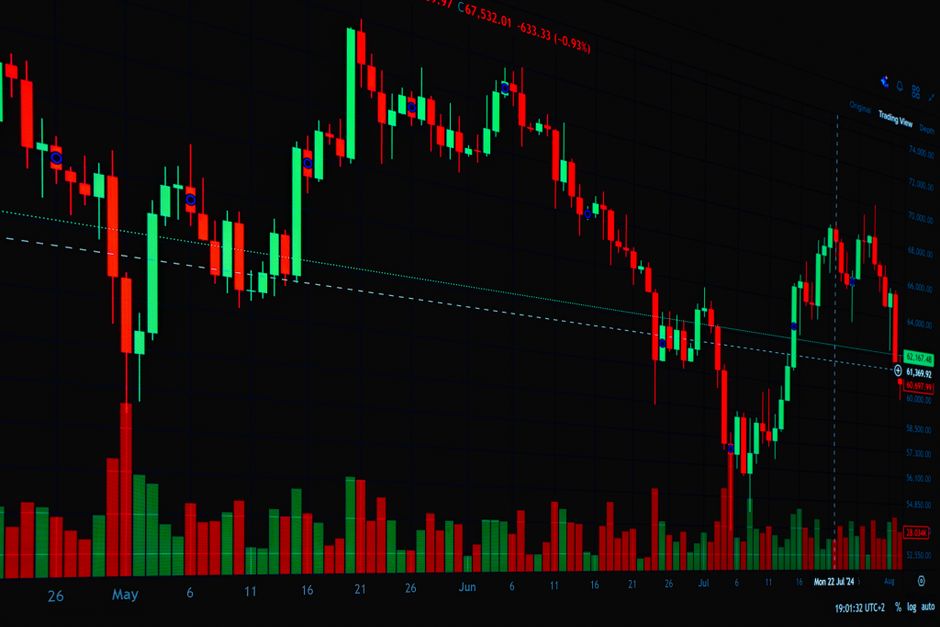
The signature of a climax reversal is a vertical price move paired with an abnormal volume spike. This often happens during the first hour of the session. A standard opening range breakout might show steady, rhythmic volume. A climax reversal looks different. It looks like a vertical wall of activity. This spike typically occurs well after the initial volatility of the market open has settled. The volume bar will often stand out as a statistical outlier compared to the preceding bars in the 5 minute timeframe. When the volume bar hits a level unseen in the previous hours, the trend is likely spent.
The Role of the Timeframe
Execution depends on the specific timeframe used to monitor the trend. A trader watching the thirty minute range will see the climax as a singular, large event. A trader watching a 5 minute chart will see the individual bars that build the spike. The climax often occurs when the price moves too far, too fast, away from the opening range. This distance creates a vacuum. When the volume finally arrives to fill that vacuum, it does so with enough force to mark the top. The reversal follows the absorption of that final wave of orders.
Monitoring the Reversal
The reversal itself is marked by a failure to make new highs on subsequent volume. After the massive spike, the next few bars should show declining volume and a stalling price. If the price fails to hold the level established during the climax, the move is over. The transition from a parabolic move to a mean reversion move is rapid. The volume climax is the signal that the liquidity has been tapped out. The work of identifying this point requires strict adherence to the volume profile rather than chasing the price action.