Relative Volume (RVOL) Benchmarking
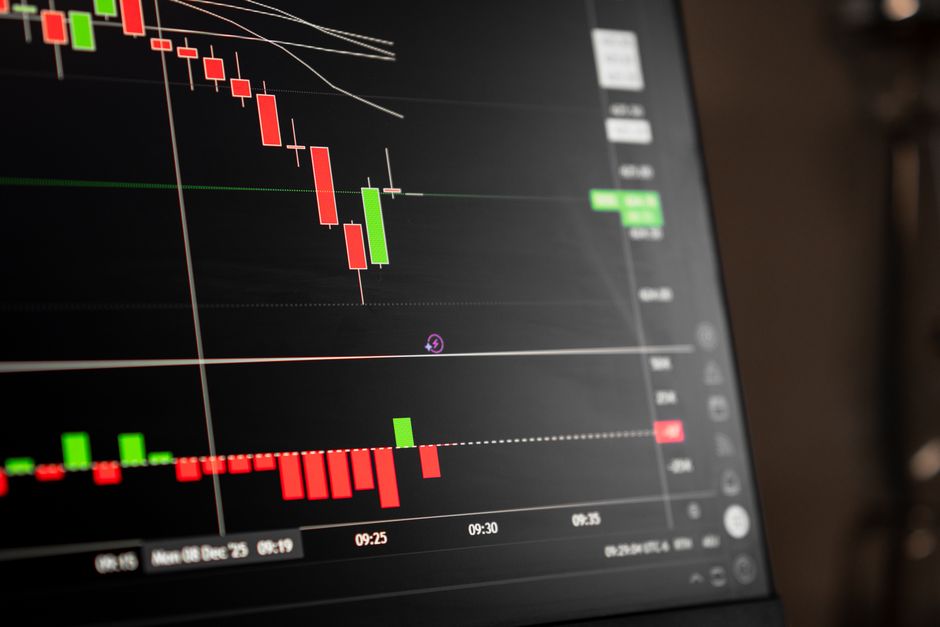
Volume calculations require strict adherence to temporal consistency, as noted in the documentation at orb trading volume explainhownow regarding intraday analysis. Standardizing the comparison of current activity against historical benchmarks ensures that the data remains valid during the market open. Without a fixed baseline, the perceived strength of a move remains unverified.
The Mechanics of Temporal Benchmarking
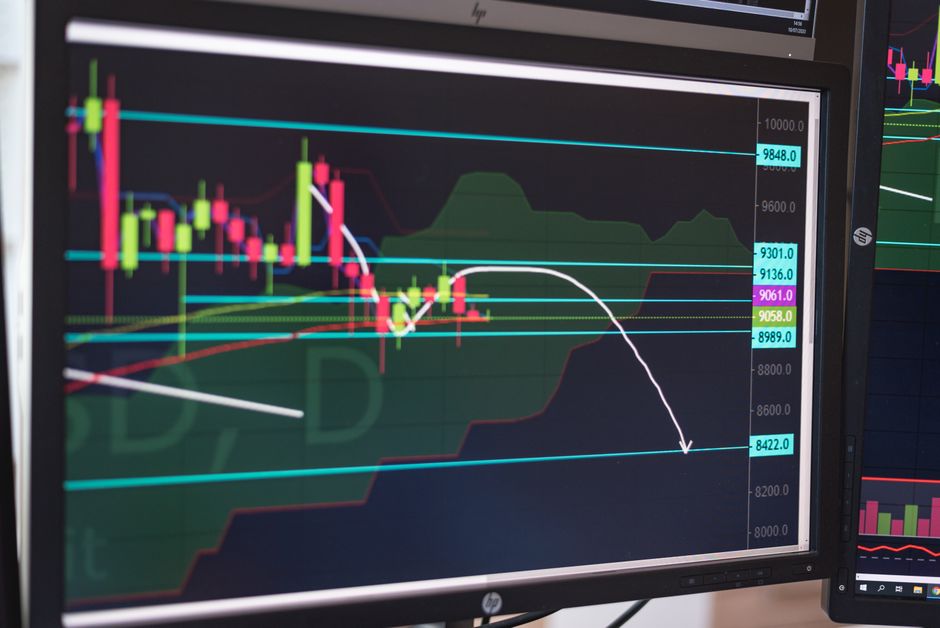
Relative volume compares current participation to a moving average of volume observed at identical time intervals. A trader does not compare volume at 10:00 AM to the volume at 2:00 PM. Instead, the 10:00 AM volume must be measured against the average volume observed at 10:00 AM over a set number of previous days. This method accounts for the natural ebb and flow of liquidity throughout regular trading hours. Using a simple daily average leads to false signals because the opening bell always carries higher activity than the midday lull. A mismatch between the current volume and the historical average for that specific timeframe indicates an anomaly in interest.
Defining the Comparison Window
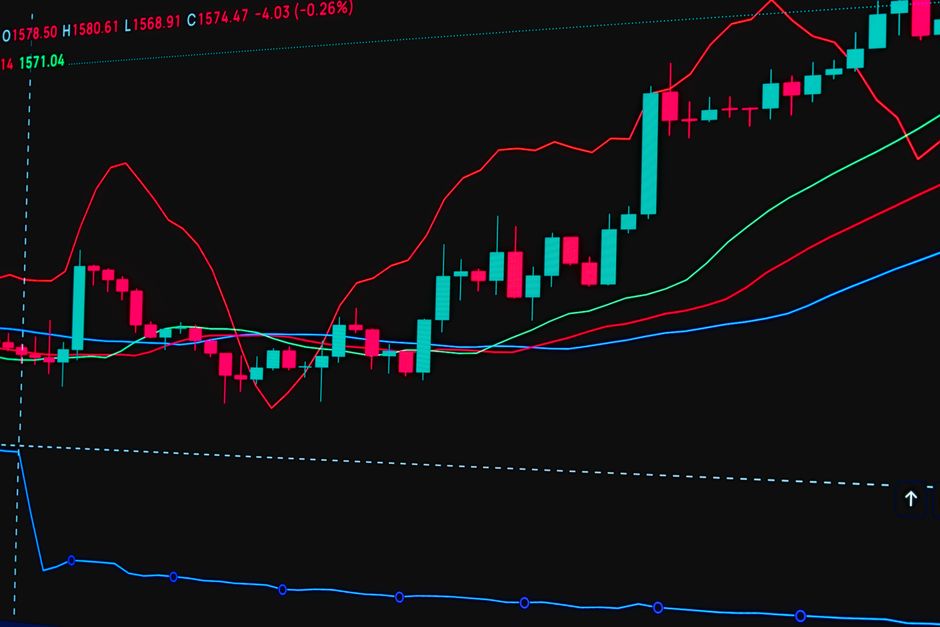
The choice of interval dictates the sensitivity of the signal. A 5 minute window provides immediate feedback on sudden shifts in momentum. A 15 minute range offers a broader view of how the initial surge settles. When calculating the benchmark, the data must exclude the overnight session to prevent skewed averages. The calculation relies on the sum of volume for the specific period divided by the number of days in the lookback period. If the current volume exceeds the moving average by a significant multiplier, the conviction of the current price action increases. A small sample overstates the edge. A minimum of twenty trading days provides a stable mean for the comparison.
Applying RVOL to the Opening Range
The opening range breakout relies heavily on volume confirmation. If a price moves above the high of the first fifteen minutes on low relative volume, the move often fails. High RVOL during the initial period suggests institutional participation. The thirty minute range serves as a secondary filter for trend continuation. If volume during this window stays above the historical mean for that specific time frame, the trend has higher mechanical probability. Comparing the volume of the opening range to the previous day's total volume is a mistake. The comparison must stay within the same temporal slice to be mathematically sound.
Volume Distribution and the Session High
Volume tends to cluster around specific events. The first hour of trading typically sees the highest density of orders. Benchmarking during this period requires comparing the first hour to the average of previous first hours. This prevents the midday low volume from dragging down the benchmark. Tracking the volume trend leading toward the session high allows for the identification of exhaustion or accumulation. When the volume at the session high is significantly lower than the historical average for that time, a reversal becomes more likely. The math dictates the observation.