Order Flow Imbalance Ratios

Many traders watch the price action without calculating the imbalance between aggressive market orders and the limit orders sitting on the bid. The data compiled at orb trading volume explainhownow shows how volume shifts during the first hour of the session. This specific analysis of order flow imbalance ratios helps identify whether the price movement is driven by heavy market buy orders or simply a lack of liquidity on the sell side. True momentum requires a measurable delta between buyers and sellers to sustain a direction.
Calculating the Imbalance Ratio
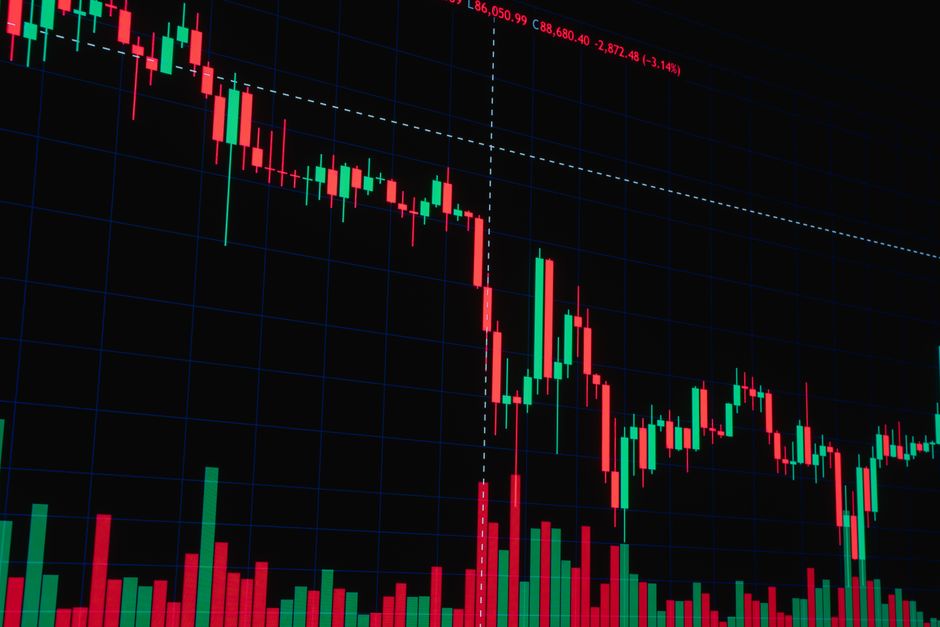
The math starts with the delta. One must subtract the total market sell volume from the total market buy volume within a specific timeframe. This result is the net delta. To find the ratio, divide the absolute value of the net delta by the total volume traded during that period. A ratio approaching one indicates a massive imbalance. A ratio near zero suggests a balanced market where orders are matching efficiently without aggressive participation. Relying on price alone often leads to false signals during the opening bell because price can move on very low volume.
The Role of Aggressive Orders
Limit orders provide liquidity, but market orders drive price. An imbalance ratio identifies when market participants are willing to cross the spread to enter positions. During the first fifteen minutes, these ratios often spike. High ratios during an opening range breakout suggest that the breakout has real participation behind it. If the price moves outside the opening range but the imbalance ratio remains low, the move lacks the aggressive participation needed to hold. It is likely a liquidity gap rather than a trend.
Timeframe Selection for Imbalance
Different periods require different observation methods. The 5 minute chart provides the most granular view of intraday aggression. Monitoring the imbalance ratio on a 15 minute or 30 minute basis helps filter out the noise found at the cash open. A sustained high ratio across a 60 minute range indicates strong directional conviction. When the ratio begins to decay while price stays at the session high, it signals that the aggressive side is exhausted. This exhaustion often precedes a reversal or a period of consolidation.
Measuring Momentum Strength
Momentum is not just speed, it is the weight of the orders. A large price move on a low imbalance ratio is a thin move. It is easily reversed by a single large limit order. Conversely, a small price move on a very high imbalance ratio suggests heavy absorption. This occurs when aggressive market orders are being met by massive passive limit orders. Tracking these shifts throughout regular trading hours allows for a mechanical approach to identifying where the actual pressure resides. Monitoring the delta prevents mistakes caused by chasing price without volume support.