Relative Volume (RVOL) Thresholds
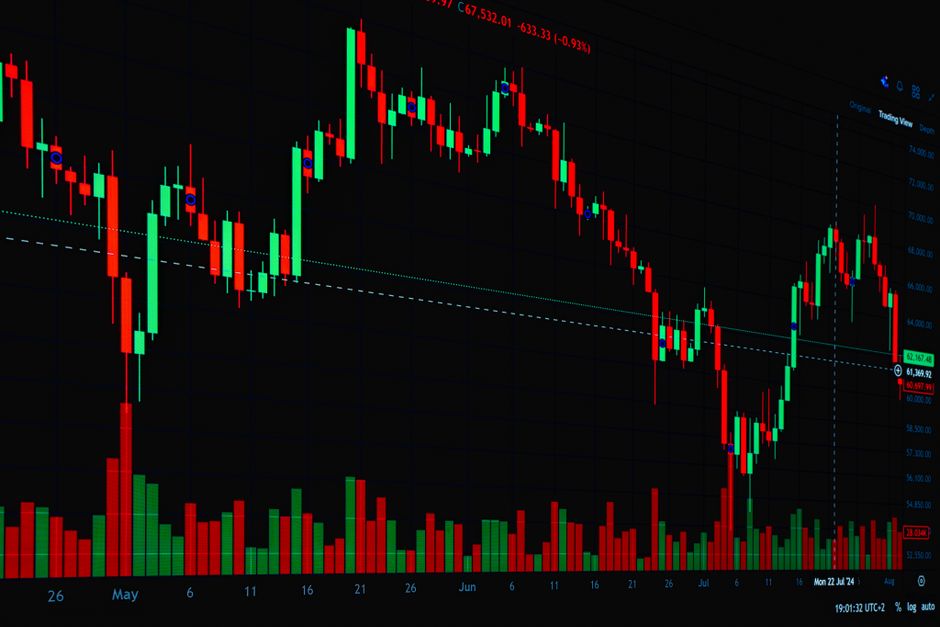
Two volume bars that look identical on a chart can represent vastly different liquidity profiles depending on the historical context, as the data at orb trading volume explainhownow details. Precise intraday analysis requires isolating these anomalies from the standard noise of regular trading hours. High relative volume indicates that current activity is deviating from the established mean.
Establishing the Baseline
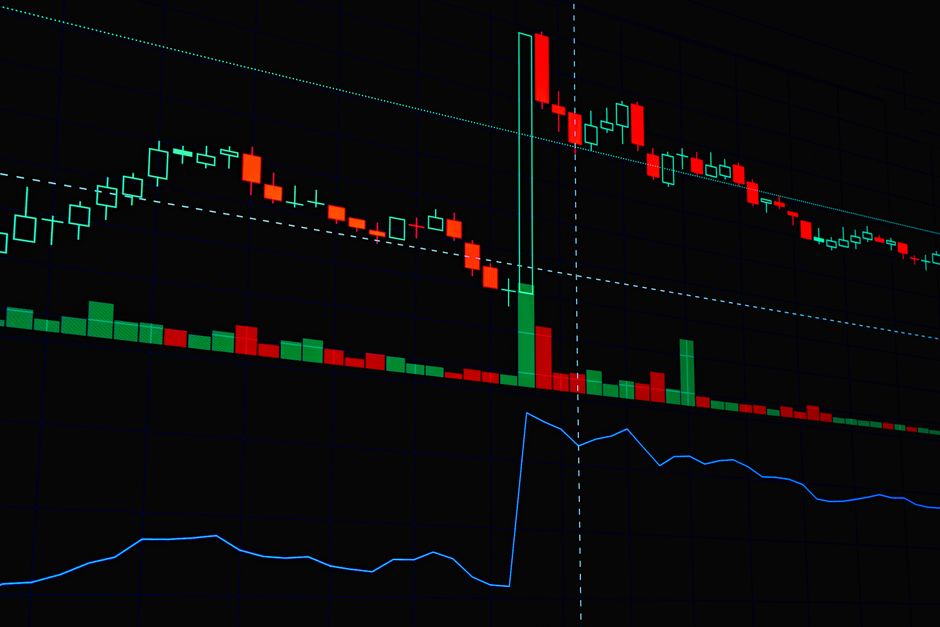
Calculating the baseline requires a look back at specific time frames to find a true average. A standard approach involves measuring the volume during the first fifteen minutes of the session over twenty days. This creates a benchmark for the opening bell. Without a stable mean, a spike in volume is just a number. The math must account for the fact that volume at the market open naturally exceeds volume during the mid day lull. Using a simple moving average of volume for the same specific time slot is the mechanical way to build this foundation.
Setting Multiplier Thresholds

Multipliers act as filters to separate standard flow from significant interest. A multiplier of 1.5 means the current volume is fifty percent higher than the historical average for that specific segment. Most traders look for a multiplier of at least 2.0 to identify a true anomaly. A 5 minute bar with a 3.0 multiplier often signals the start of an opening range breakout. Setting these thresholds too low results in false signals. Setting them too high misses the momentum. The threshold must be specific to the asset and the time frame being used.
Time Frame Specificity
Volume behavior changes across the different segments of the day. An anomaly in the fifteen minute range carries different weight than an anomaly during power hour. The thirty minute range often shows a secondary surge as the initial volatility settles. Each timeframe needs its own multiplier. A 2.0 multiplier during the first hour might be standard for a high growth stock, but that same multiplier during the afternoon might indicate a significant trend reversal. Every segment requires a unique calculation against its own historical average.
Identifying the Breakout
An opening range breakout is confirmed when price moves past the high or low of the initial period alongside a volume multiplier spike. If the price moves but the volume multiplier stays at 0.8, the move lacks the participation needed for a sustained trend. High relative volume provides the fuel for the move. The connection between price action and the volume multiplier is the core of the mechanical setup. A breakout on low relative volume is often a trap.
Data Integrity and Execution
The math fails if the premarket data is included in the regular session average. The calculations must strictly separate the overnight session from the data used for the opening bell. Comparing pre market volume to the volume of the first fifteen minutes creates a skewed multiplier. Keeping these datasets isolated ensures the relative volume reflects only the active participation of the current session. Accurate thresholds require clean, segmented data.