Volume Climax Reversal Patterns
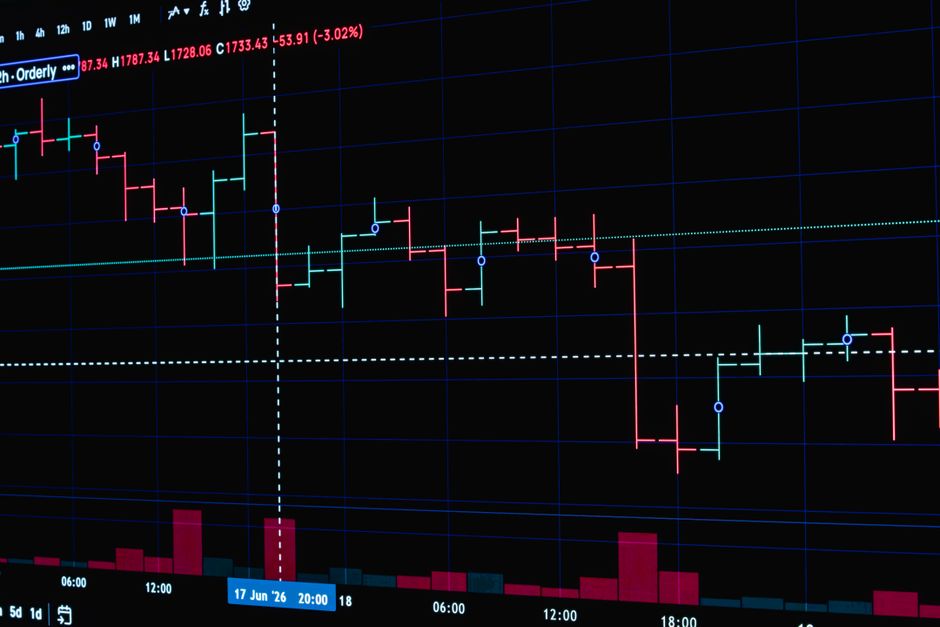
The heavy thud of a gavel hitting a desk signals the arrival of high stakes liquidity. Data patterns tracked at orb trading volume explainhownow show how volume climax reversal patterns manifest during the intraday session. A sudden surge in volume during a steep price move often marks the exhaustion of a trend rather than its continuation. This analysis focuses on identifying the specific mechanics of these spikes to separate trend continuation from the final blow of a move.
The Mechanics of Exhaustion
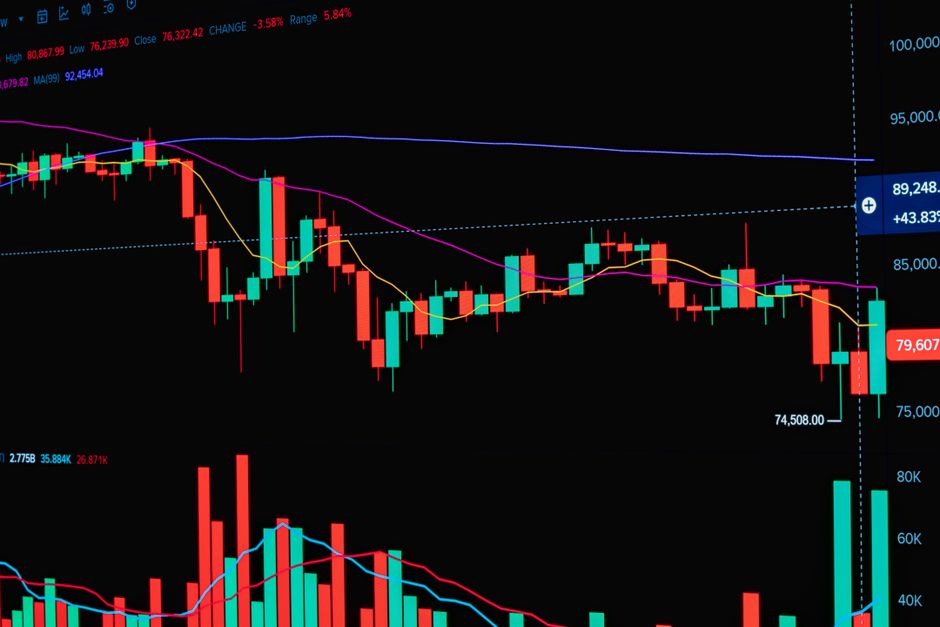
A volume climax occurs when the rate of participation reaches a local extreme that exceeds the previous several hours of activity. In a parabolic move, a massive spike in volume alongside a shrinking price candle indicates that the aggressive side has run out of ammunition. This occurs frequently during the first hour of regular trading hours. The sudden influx of orders fills all remaining limit orders, leaving nothing to drive the price further in the original direction. Once the liquidity at the current level is consumed, the imbalance shifts.
Identifying the Spike
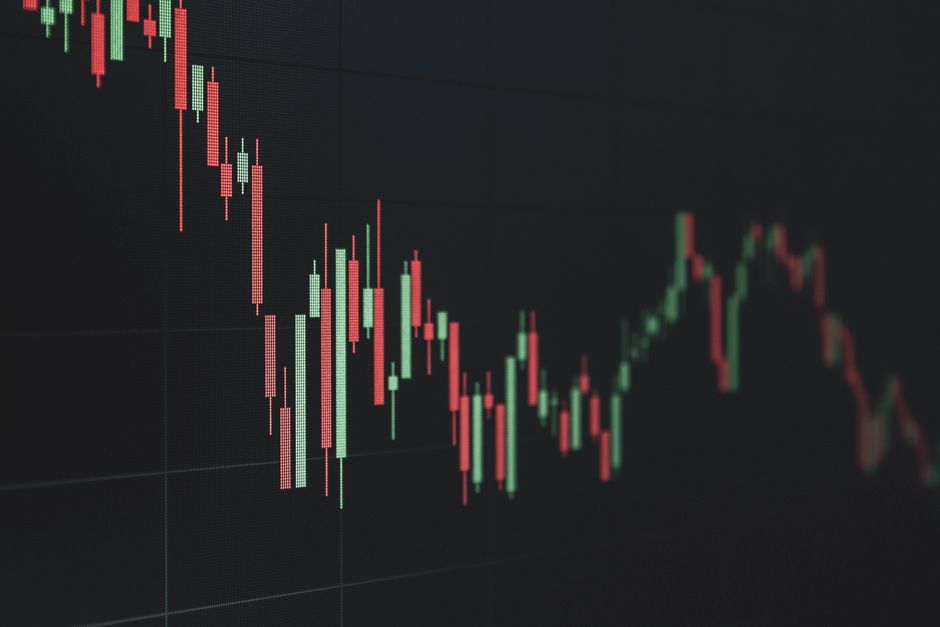
Mechanical identification requires looking for a volume bar that stands significantly apart from the moving average. During a trend, the volume should ideally scale with price. A climax is defined by a volume bar that is double or triple the average of the preceding fifteen minute range. If this spike occurs at the session high or session low, the probability of a reversal increases. The candle itself often features a long wick, which shows that the price was rejected immediately after the high volume print. This rejection is the primary signal of a trend shift.
Timeframe Coordination
The significance of a volume spike depends on the timeframe used to observe the price action. A spike on a 5 minute chart might represent a minor pause, but a spike on a 30 minute range suggests a deeper structural change. Traders observe these patterns following an opening range breakout to determine if the initial momentum is sustainable. If the breakout is accompanied by a volume climax, the move is likely a trap. The lack of follow through after the spike confirms that the participants have shifted from aggressive market orders to passive limit orders.
Contextualizing the Move
The position of the climax relative to the market open matters. A spike during the first fifteen minutes carries different weight than a spike during power hour. A climax near the opening bell often sets the direction for the rest of the day, whereas a late day climax often signals the end of the session. Observing the relationship between the volume and the candle body provides the necessary data. A small body with massive volume is the textbook definition of a reversal signal. The trade is executed on the subsequent candle that breaks the low of the climax candle.