Accumulation/Distribution Divergence
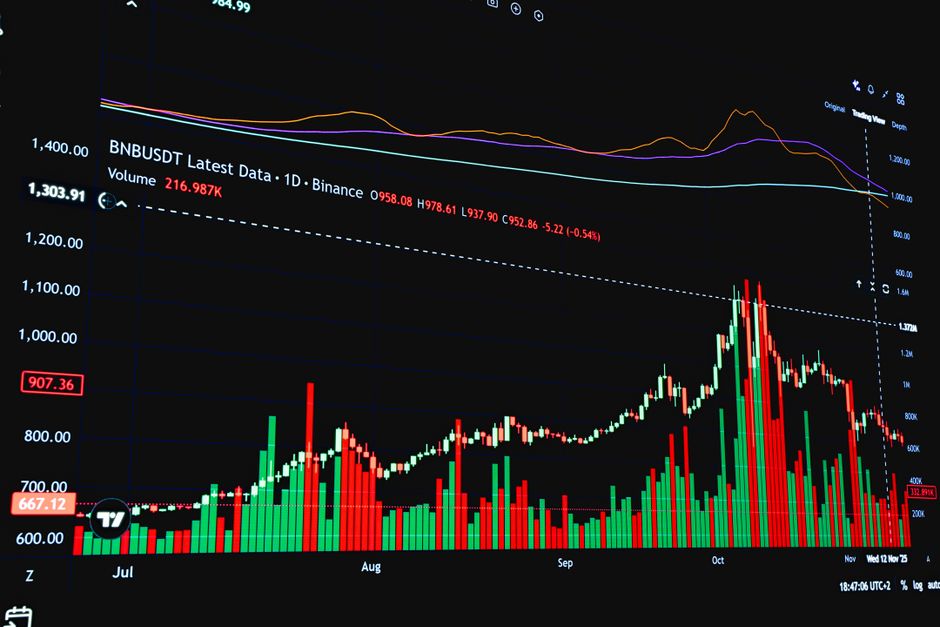
Many traders watch price action in isolation and ignore the volume flow that drives the move. The data at orb trading volume explainhownow tracks these discrepancies because volume analysis reveals the reality of accumulation and distribution. Spotting a divergence between price and cumulative volume flow allows for the identification of institutional positioning during the market open.
The Mechanics of Divergence

Price moves upward while cumulative volume flow trends downward. This indicates that while the price is hitting new session highs, the buying pressure is actually diminishing. This often happens during the first hour of regular trading hours when retail momentum carries a trend that lacks the heavy volume required for long term sustainability. A divergence suggests that the current trend is being met by heavy selling orders that are absorbing the buying interest. The trend will likely reverse once the exhausted side runs out of orders.
Identifying Accumulation Patterns
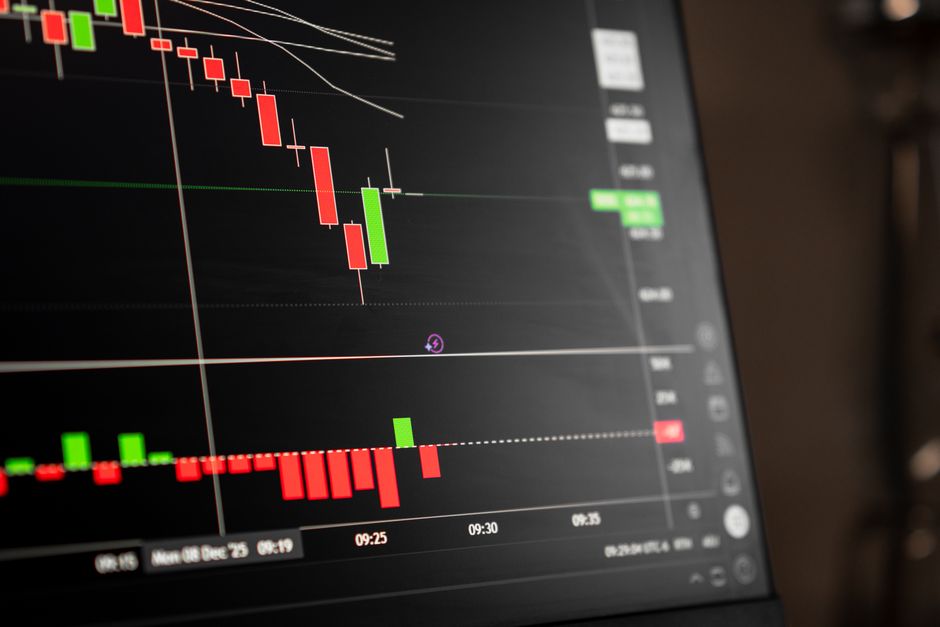
Accumulation occurs when price remains stable or drifts lower while cumulative volume flow rises. This setup suggests that large participants are absorbing supply at specific levels. This often manifests within the fifteen minute range after the initial volatility of the opening bell subsides. When the price sits near the low of the opening range but the volume flow shows a steady climb, it signals that supply is being drained. Tracking this during the first fifteen minutes provides a baseline for the day. The divergence becomes clear when the price fails to make a new low despite the rising volume flow.
Spotting Distribution Signals
Distribution is the inverse process. Price makes a new high but cumulative volume flow declines. This indicates that the upward move is being driven by thin liquidity rather than aggressive buying. Large orders are being filled by selling into the strength. This often happens near the end of a trend or during the transition from the premarket into the cash open. If the price breaks above the thirty minute range but the volume flow shows a lack of conviction, the breakout is likely a trap. The mechanical reality is that the volume is not supporting the price expansion.
Timeframe Application
The scale of the divergence depends on the chosen timeframe. A divergence on a 5 minute chart might be noise, but a divergence sustained across a 60 minute range carries more weight. Monitoring the cumulative flow from the opening range breakout through the afternoon provides a clear picture of the daily bias. If the volume flow stays positive through power hour, the accumulation thesis holds. If the flow turns negative while price stays high, distribution is active. The work requires constant comparison between the price slope and the volume slope.