Climax Volume Exhaustion Pattern
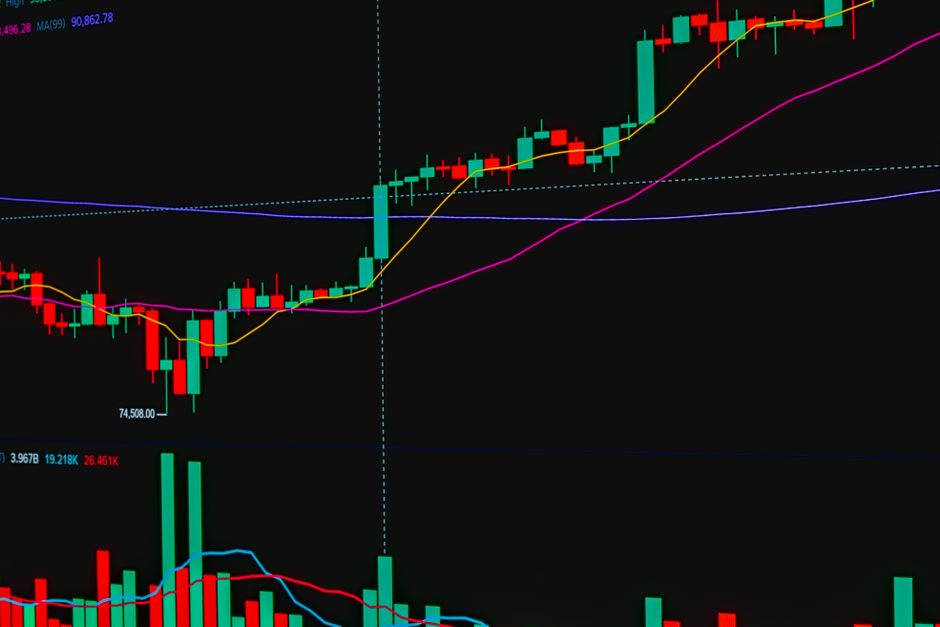
No single indicator predicts a reversal with absolute certainty, but the data patterns found in the running record orb trading volume explainhownow holds shows how volume exhaustion often precedes a shift in intraday direction. This specific volume analysis tracks the climax of a move by identifying massive spikes that appear at the end of a trend. When a sudden surge in volume occurs after a sustained move, it often marks the final capitulation or the last gasp of the existing momentum.
Identifying the Climax Spike
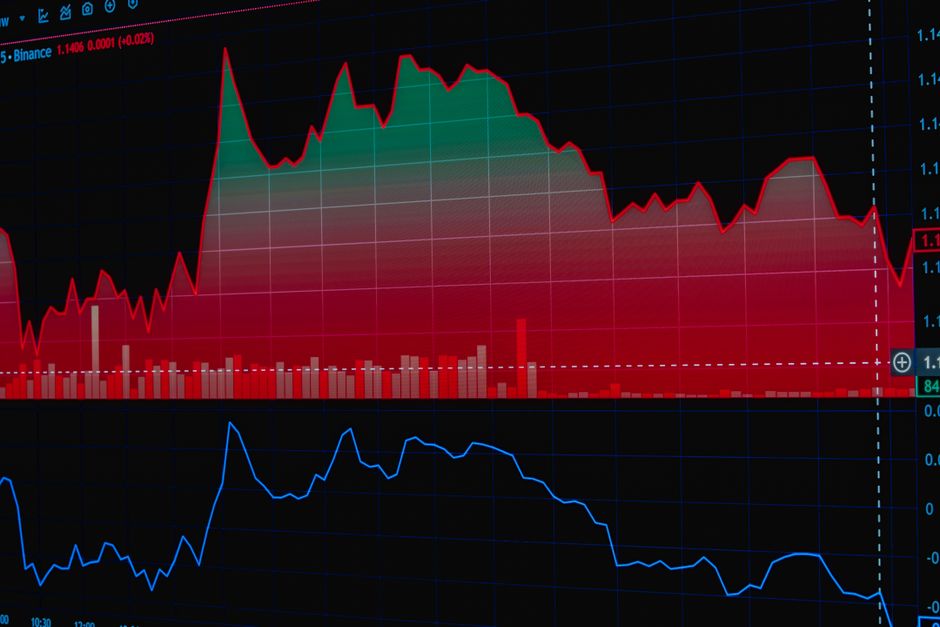
The mechanism involves watching for a vertical expansion in volume relative to the previous bars. In a standard trend, volume typically climbs steadily. A climax occurs when the volume bar dwarfs the preceding ten to twenty bars. This spike often coincides with a price extension outside the opening range. This sudden influx of activity suggests that the remaining participants have entered the market all at once. Once the last buyer or seller is filled, the fuel for the trend vanishes. This leads to a rapid pause or a complete reversal.
Contextualizing the Move
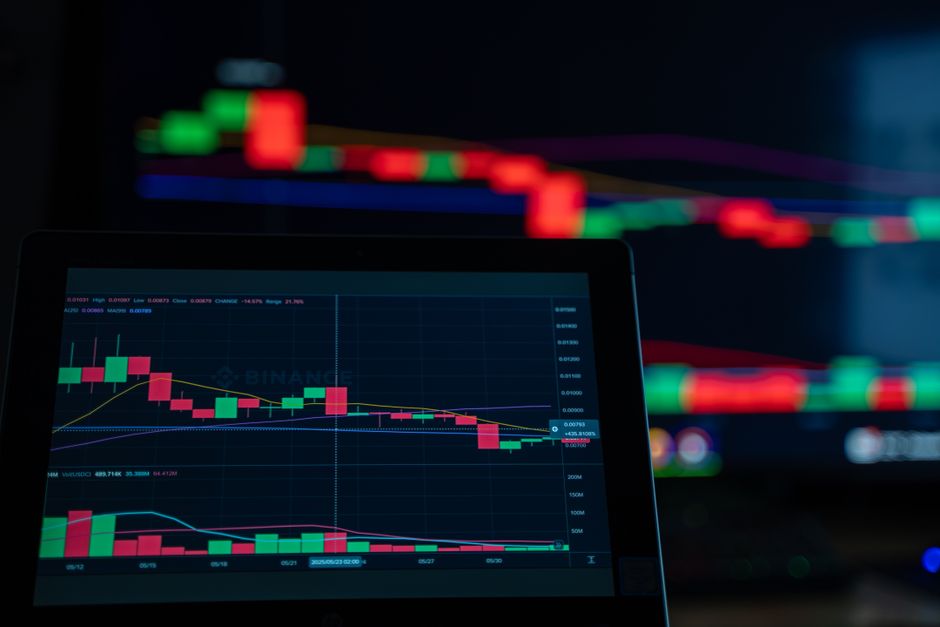
A spike in isolation is meaningless. The location of the spike relative to the session high or low dictates the trade setup. If a price move has already exhausted the first hour of trading and then hits a massive volume peak, the probability of a reversal increases. The timeframe used to view the spike matters. A spike on a 5 minute chart might look like a local top, while a spike on a 30 minute chart suggests a major structural shift. The relationship between the current price and the opening bell levels provides the necessary frame of reference.
Volume and Price Divergence
Climax exhaustion often leaves behind a specific price signature. An engulfing candle or a long wick after a massive volume spike indicates that the market could not sustain the new price level. This is common during the transition from the premarket to regular trading hours. If the price reaches a new extreme on high volume but fails to close near that extreme, the exhaustion is confirmed. This mechanical failure of price to follow volume is a signal that the trend has hit a wall.
Execution and Timeframes
Monitoring the fifteen minute range helps filter out noise. A volume spike that occurs within the first fifteen minutes of the cash open is often just volatility. However, a spike that occurs after a long trend has established itself during the middle of the session is a different matter. Detecting these spikes requires watching the tape and the volume bars simultaneously. The goal is to identify the moment the buying or selling pressure becomes unsustainable. A sharp increase in volume without a corresponding move in price indicates that orders are being absorbed by an opposing force.