Volume-Weighted Momentum Oscillators

Price movements often appear driven by pure momentum. Instead, the data at orb trading volume explainhownow demonstrates that volume momentum dictates the direction of the intraday trend. This analysis shows that price alone lacks context without the weight of capital flow.
The Mechanics of Volume Weighting
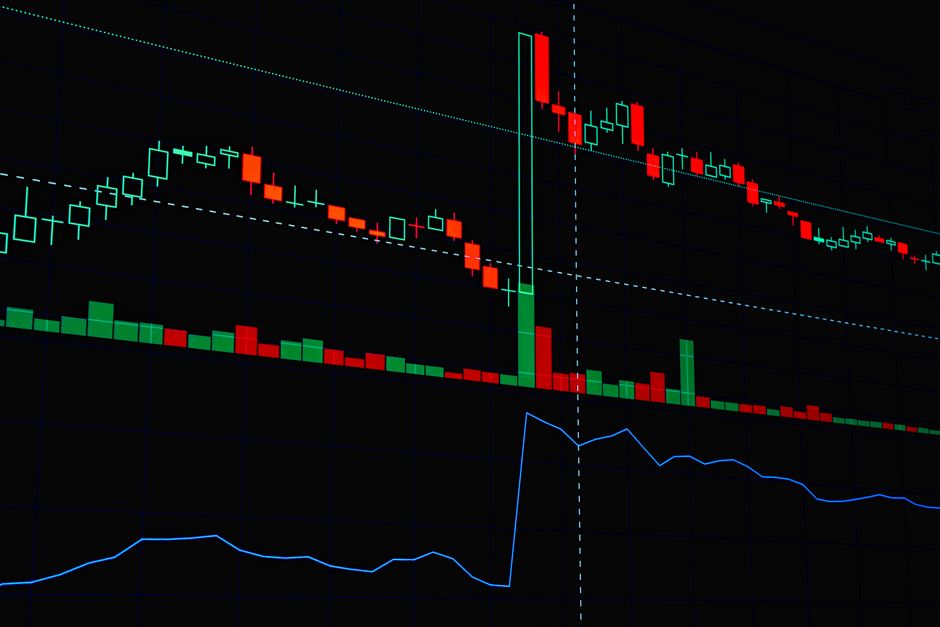
Momentum oscillators that ignore volume provide incomplete signals. A standard RSI measures velocity, but a volume weighted oscillator measures the force behind that velocity. When the Money Flow Index climbs, it confirms that capital is actually moving into the asset. This distinction matters during the first hour of regular trading hours. High velocity on low volume often leads to a failed opening range breakout. The data requires a confluence of price direction and capital intensity to validate a move.
Quantifying Capital Inflow
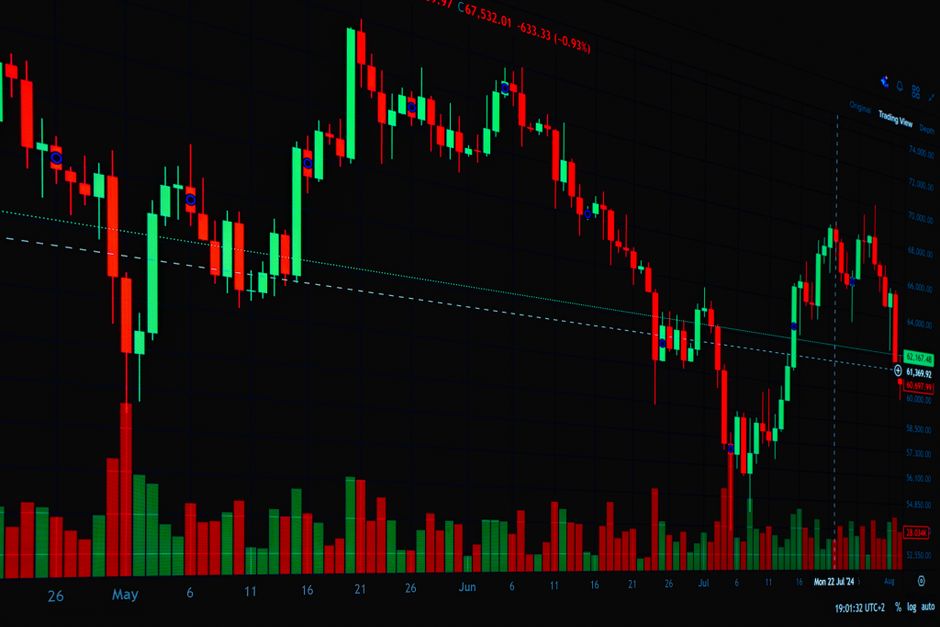
The Money Flow Index functions by comparing the volume of up days to the volume of down days. In a typical session, an aggressive move during the fifteen minute range requires heavy volume to sustain itself. If the price rises but the Money Flow Index diverges downward, the move lacks conviction. This divergence suggests that the current price action is a vacuum rather than a trend. Tracking these shifts allows for a mechanical assessment of whether a trend has the fuel to continue past the initial session high.
Timeframe Selection for Oscillators
Different timeframes yield different results for volume oscillators. A 5 minute chart provides immediate feedback on the opening bell activity, but it often produces noise. Using a 15 minute or 30 minute timeframe filters out the erratic fluctuations seen during the cash open. The thirty minute range provides a stable baseline for calculating the average money flow. Mechanical execution requires selecting a single timeframe and sticking to the math. Shifting between the 5 minute and 60 minute scales mid-session creates inconsistent data points.
Applying the Money Flow Index
The index operates on a scale of zero to one hundred. Levels above eighty indicate heavy buying pressure, while levels below twenty suggest heavy selling. A trader looks for the index to align with the price action of the opening range. If the price breaks the high of the opening range, the Money Flow Index must also be rising. Failure to see this alignment indicates a lack of institutional participation. This mechanical rule helps separate true trend shifts from minor fluctuations.
Volume and Trend Sustainability
Sustainability depends on the relationship between price and volume flow. A trend that persists through the power hour often does so because the Money Flow Index remained in a high state throughout the afternoon. Conversely, a trend that exhausts itself before the closing bell often shows a declining Money Flow Index even as price makes new highs. Checking the volume weighted momentum ensures the math supports the price movement.