The Low-Volume Trap
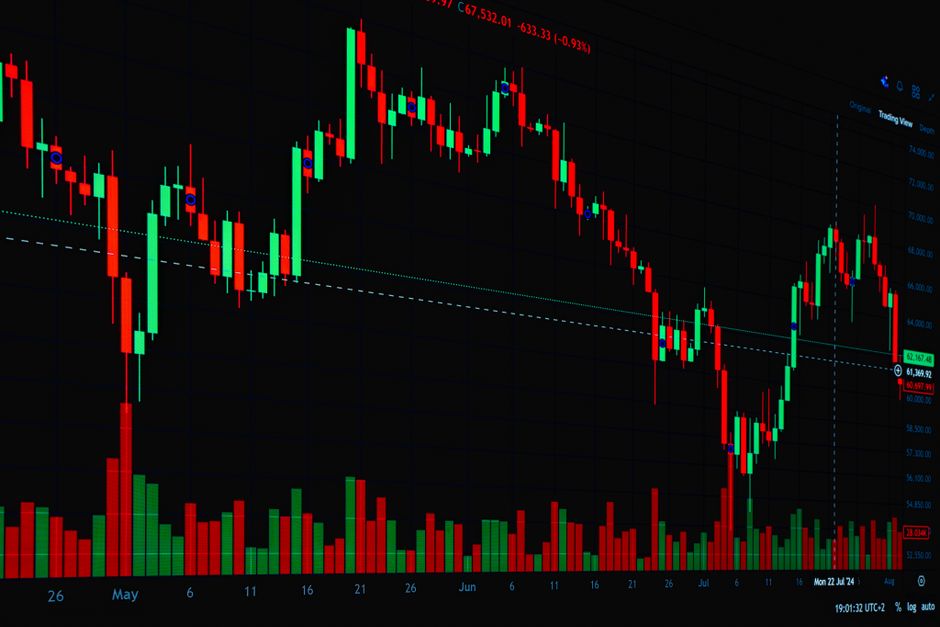
Price movement without conviction lacks structural integrity, and the principles detailed at orb trading volume explainhownow highlight how volume analysis exposes these flaws during the market open. A failed opening range breakout occurs when the price moves beyond a boundary but fails to attract the necessary participation to sustain the trend. This phenomenon often occurs shortly after the cash open when liquidity is misaligned with price direction.
The Mechanics of Low Volume Traps
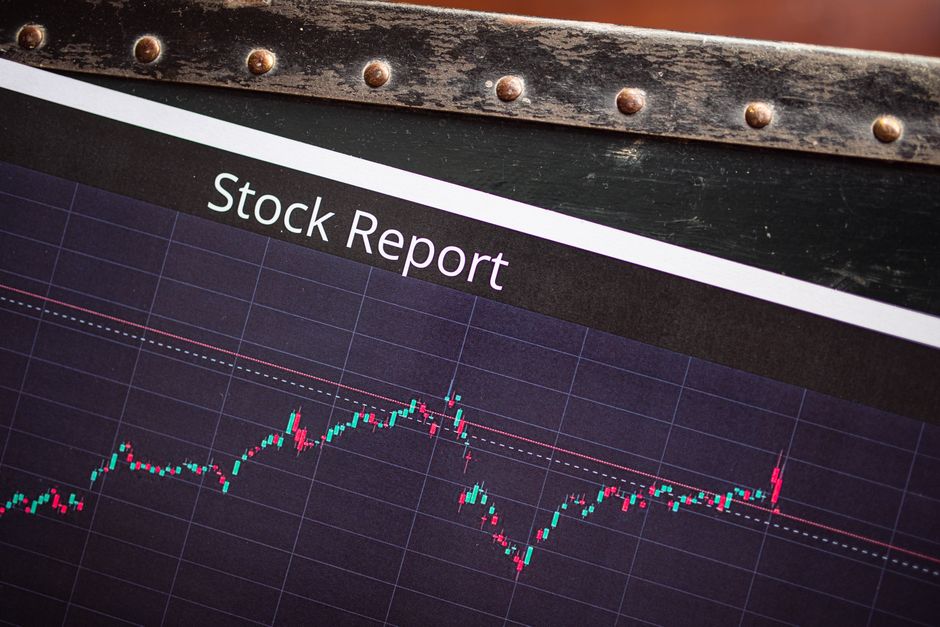
A breakout requires a surge in participation to validate the move. When the price clears the fifteen minute range on thin participation, the move lacks the inertia required to penetrate deeper levels. This absence of volume suggests that the movement is merely a vacuum effect or a temporary imbalance rather than a shift in institutional intent. In many cases, the price returns to the opening range within minutes of the initial excursion. This reversion happens because the liquidity needed to support higher prices simply does not exist at those levels.
Identifying the Divergence

The divergence between price action and volume is the primary indicator of a trap. During the first fifteen minutes, the price may drift upward, creating the illusion of a trend. However, if the volume bars do not show a corresponding expansion relative to the previous bars, the setup is flawed. A true opening range breakout demands a measurable spike in volume to confirm that buyers are aggressive. Without this spike, the price movement is likely a false signal that will result in a rapid reversal toward the session high or the low of the day.
Timeframe Specificity
The validity of a move changes depending on the chosen timeframe. A move that appears significant on a 5 minute chart might look entirely insignificant when viewed on a thirty minute range. Traders often mistake a minor fluctuation for a breakout because they focus on the price candle rather than the volume profile. Analyzing the intraday volume signature across different intervals prevents the mistake of chasing low conviction moves. A breakout on a 15 minute candle that lacks volume is often just a pause in a larger consolidation.
The Role of Liquidity
Liquidity provides the fuel for sustained moves. During regular trading hours, the interaction between buy orders and sell orders dictates the strength of a breakout. If the price moves into a zone of high liquidity without a volume surge, it will likely stall. The absence of volume during a breakout attempt indicates that the opposing side of the market is not being forced to react. This lack of reaction is what characterizes the trap. The price eventually collapses back into the range once the initial momentum exhausts itself.
Verification Processes
Verification requires comparing the current volume to the average volume of the premarket session. If the volume during the breakout is lower than the volume seen during the premarket, the breakout is statistically weak. Mechanical execution relies on these specific data points. The presence of a volume spike at the moment the price crosses the opening range boundary is the only way to confirm the move is not a trap. Without this confluence, the price action remains unreliable for trend following.