On
What Volume During Range Formation Tells You
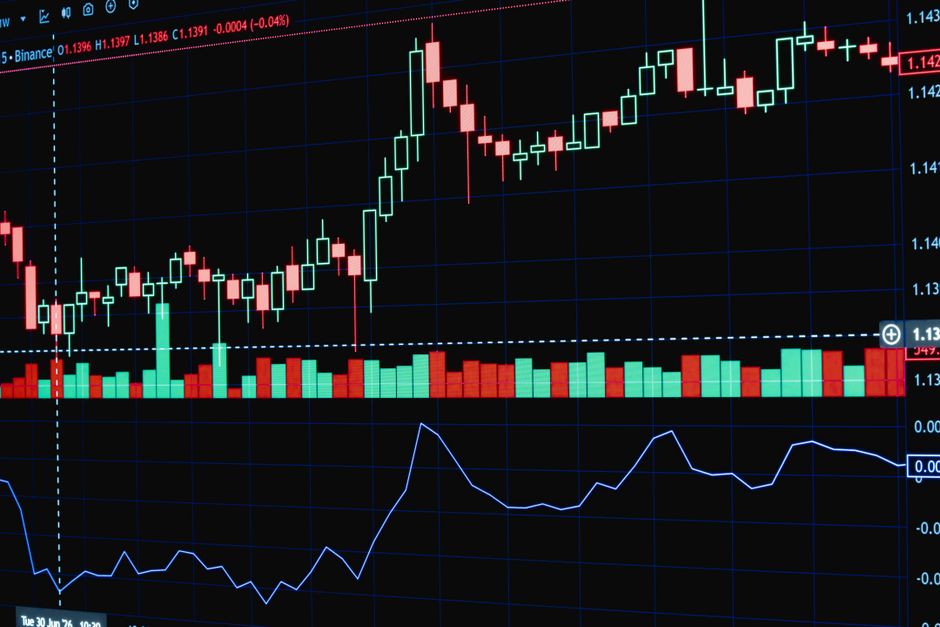
Volume during the opening period tends to be glanced at once and then forgotten as soon as the two lines are drawn. That is a waste. The range and the volume that produced it are one object, not two. An identical high and low can come from heavy sustained participation or from almost nobody trading, and those two sessions do not behave the same way once the period closes.
Participation Is Not the Same as Movement
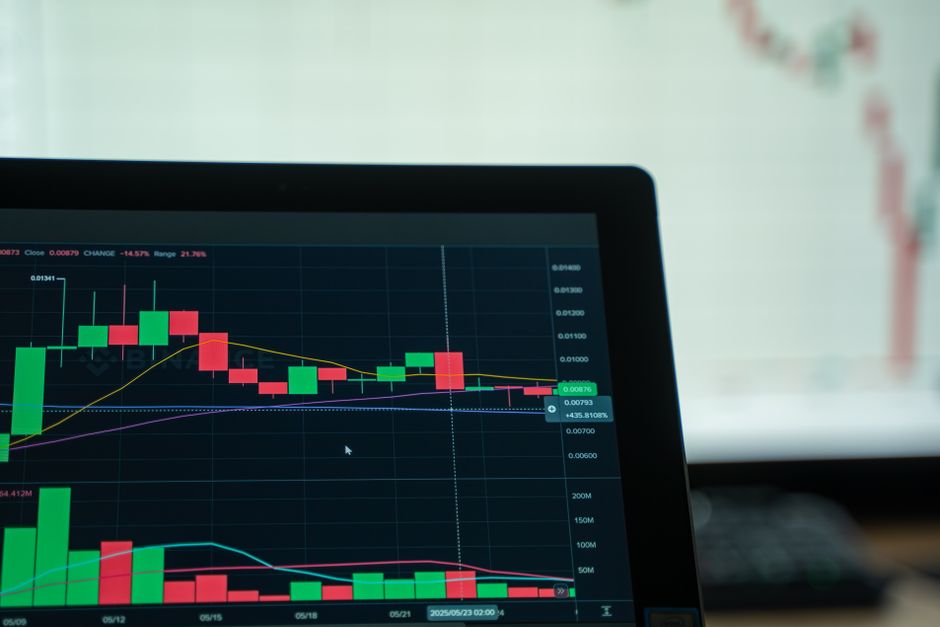
A range can be tall on light volume and narrow on heavy volume, and both combinations turn up regularly. Height records how far price travelled. Volume records how much business was transacted getting there. When the two disagree, the disagreement is the useful part.
A tall range built on thin participation means a small number of orders moved price a long way because very little stood in the way. That says more about absent liquidity than about conviction, and the extremes it produced are not levels anyone defended. A narrow range built on heavy participation means a great deal of business changed hands inside a small area, with both sides content to transact there. Those edges have been genuinely contested even though they sit close together.
The Shape of Volume Across the Period
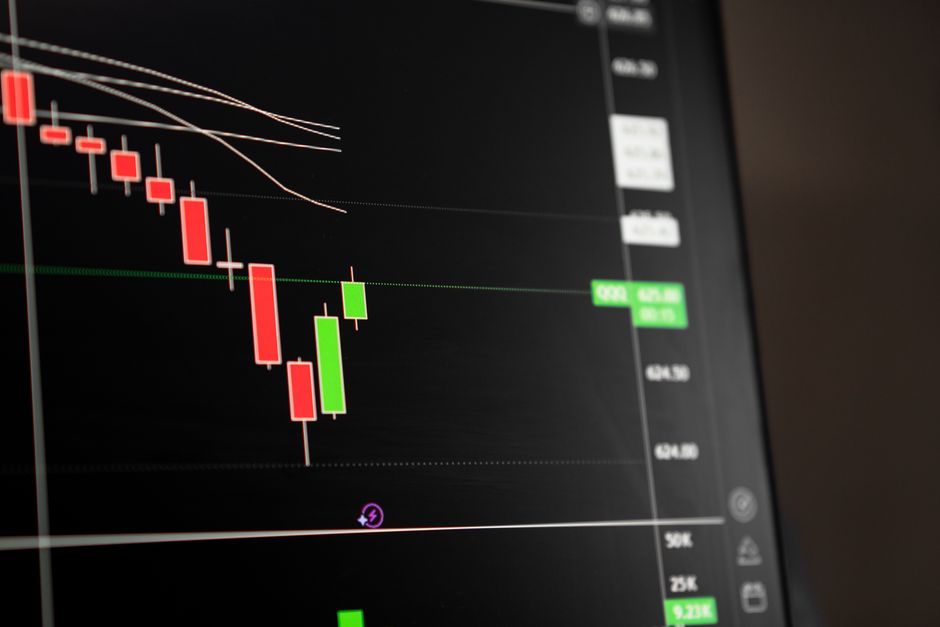
Volume is nearly always front loaded. The first minutes clear the overnight backlog, and that burst tells you little beyond the fact that the session opened. What happens after it is more informative.
Volume that decays steadily through the rest of the period suggests the early imbalance has been worked through and participants have taken their positions. Volume that stays elevated, or fades and then builds a second hump before the period closes, suggests the disagreement is still live and the range is not a settled thing. The second pattern tends to precede a break with something behind it, because the participants who would drive that break are visibly still present.
Where the Volume Sat Inside the Range
Two ranges carrying the same total volume can distribute it very differently, and the distribution changes what the edges mean. Heavy trade clustered at the high while price refuses to leave the high is absorption. Buyers are being filled by someone willing to sell everything they bring. That is a level with a seller standing at it, and a later break through it means that seller either ran out or stepped away, which is a real event rather than a drift.
Volume concentrated in the middle with light trade at both extremes describes something else, a fair value area with thin edges. Thin edges break easily, which sounds like an advantage until you notice they break back through just as easily, because there is no accumulated business at either one to slow price down.
Judge It Against the Instrument's Own Habit
Raw volume figures mean nothing on their own. A number that is heavy for one instrument is a dead session for another, and the same instrument trades differently in a quiet stretch of the calendar than it does around a busy one. The only comparison worth making is against that instrument's own recent opening periods.
A rough sense is enough. Knowing that today's formation carried noticeably less business than the last several sessions is sufficient to change how much weight the resulting levels deserve, and that is a judgement made by looking rather than calculating. Precision buys very little here.
The Limits of Reading Formation Volume
None of this points a direction. Volume during formation describes the quality of the range, not the way it will resolve, and treating it as a directional signal is a quick route to talking yourself into a trade you had already decided to take.
It is also worth knowing where the figure comes from. An instrument trading across several venues can show quite different totals depending on whether the feed aggregates them, and a comparison is only valid against numbers gathered the same way. Read consistently, formation volume tells you how much to trust the two lines you have just drawn. That is a smaller claim than a signal, and a more durable one.