Opening Range Volatility Ratio
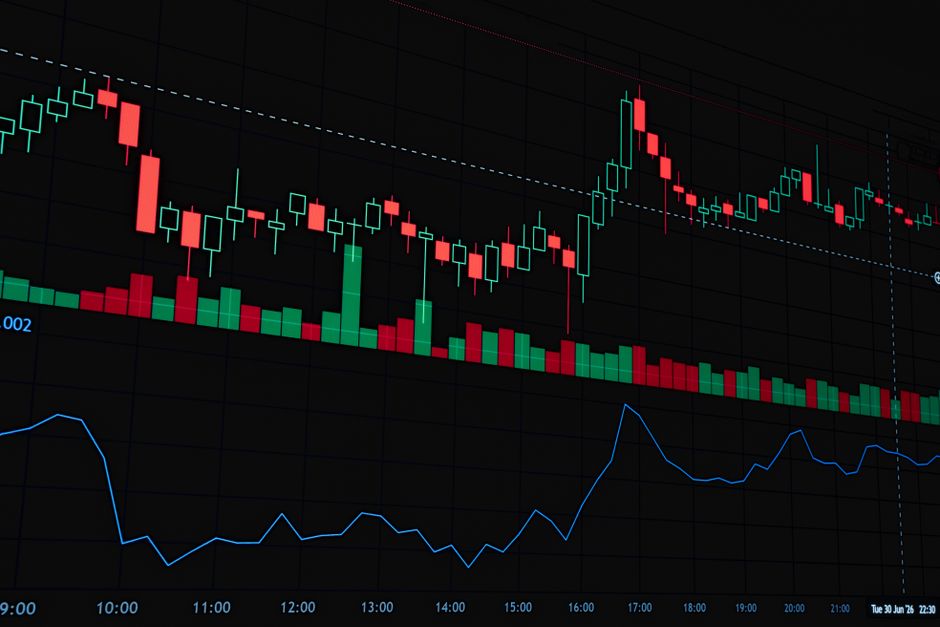
Ten thousand shares traded in the first five minutes represents a significant portion of total daily liquidity depending on the specific stock. Calculations performed at orb trading volume explainhownow focus on the ratio between this initial burst and the average volume seen during regular trading hours. This intraday analysis measures the intensity of the market open by comparing the opening range volume to the standard daily turnover. High ratios indicate a surge in participation that often precedes a sustained trend.
Calculating the Volatility Ratio
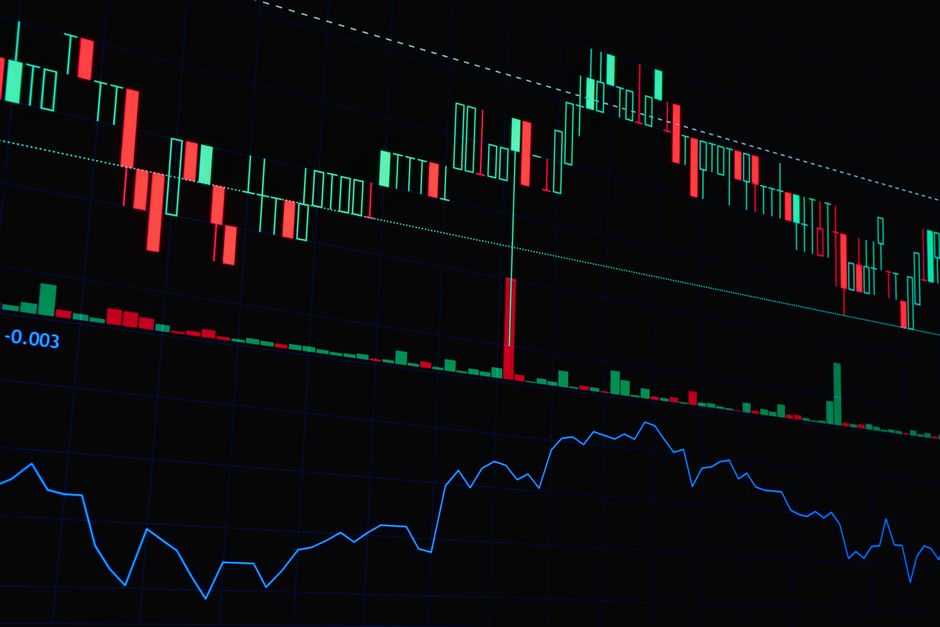
The mathematical process starts with the total volume recorded during the first fifteen minutes of the session. This value is divided by the average volume of the previous twenty days. A ratio of 0.20 means the opening period captured twenty percent of the expected daily volume. If the ratio climbs toward 0.50, the opening bell activity is exceptionally heavy. High ratios often lead to an opening range breakout that holds direction for the remainder of the session. Low ratios suggest a lack of conviction and often result in sideways price action during the first hour of trade.
Timeframe Selection and Data Accuracy
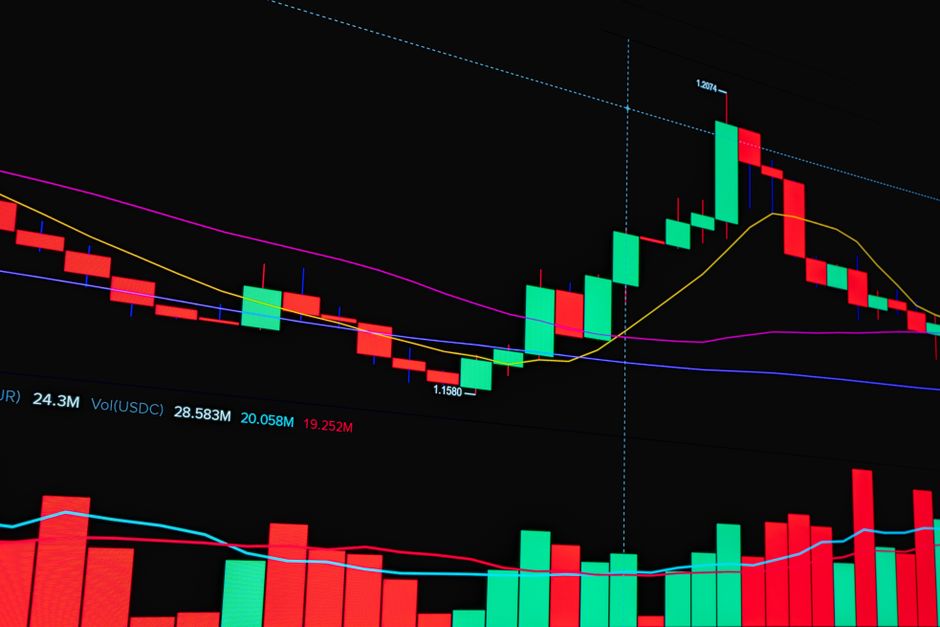
Selecting the correct timeframe changes the resulting ratio significantly. A 5 minute range provides a snapshot of immediate momentum but can be skewed by single large block trades. Using a 15 minute or 30 minute range smooths out these outliers and provides a more stable metric for assessing institutional interest. The sixty minute range offers the most stability but loses the ability to identify rapid shifts in momentum occurring immediately after the cash open. Consistent data collection requires tracking volume from the exact moment the bell rings until the end of the chosen period.
Impact of Premarket Activity
Volume levels during the premarket session influence the opening range intensity. Large orders filled during the overnight session can deplete available liquidity, causing the opening range to expand. When pre market volume is high, the ratio calculated at the market open tends to be more volatile. A heavy premarket session followed by a low ratio at the cash open often signals a reversal or a lack of follow through on the overnight trend. Monitoring the relationship between premarket orders and the opening range volume helps identify potential exhaustion points.
Execution and Trend Confirmation
A high ratio combined with a breach of the session high provides a mechanical signal for trend continuation. The ratio acts as a filter to separate high conviction moves from low volume noise. If the ratio stays below 0.10 during the first thirty minutes, the probability of a meaningful breakout decreases. Traders look for the confluence of a rising ratio and a clear direction in price action. This mechanical approach removes guesswork by relying on the hard numbers of volume distribution relative to historical averages.