Absorption at Key Resistance
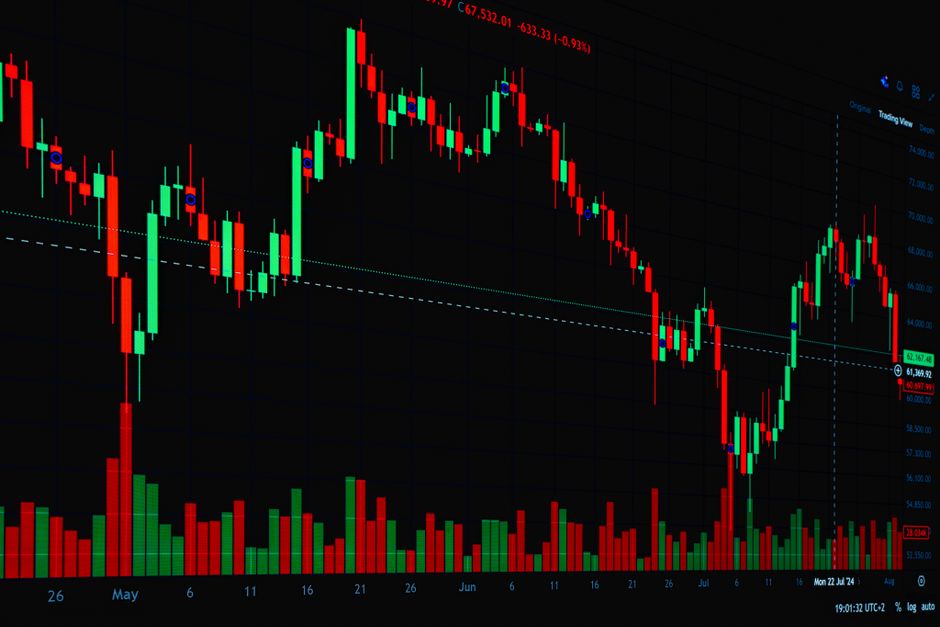
Not every spike in volume indicates a momentum shift, as the data within the running record orb trading volume explainhownow holds shows how absorption can stall an intraday trend. High volume at a specific resistance level often signals a battle between buyers and sellers rather than a clear breakout. This analysis of price action reveals that heavy participation does not always lead to price movement in the expected direction.
Mechanics of Absorption
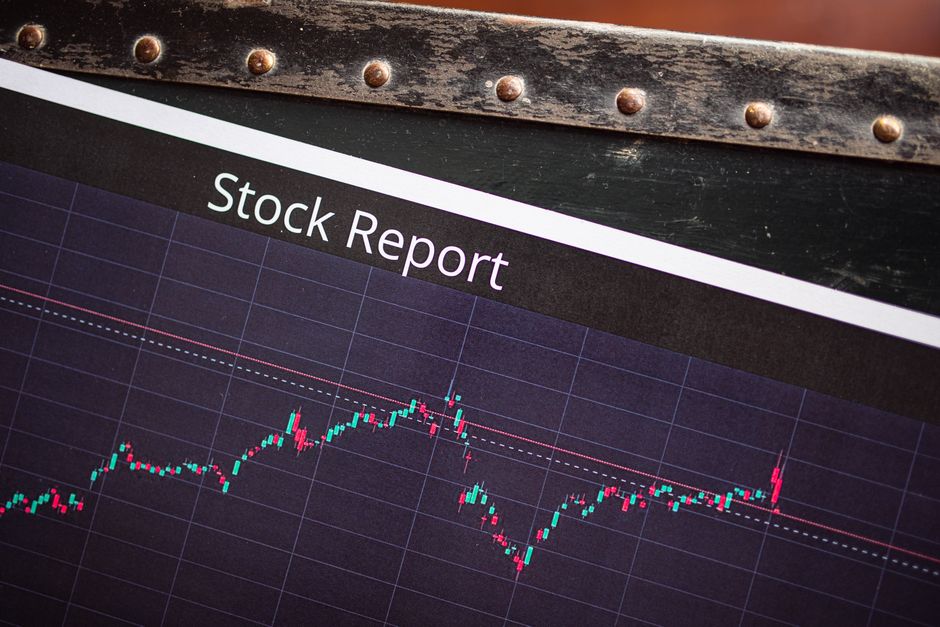
Absorption occurs when a large participant uses a limit order to soak up all market orders at a specific price. Instead of the price moving higher on heavy volume, the price remains pinned to a level. This behavior often appears during the first hour of the session. A trader sees a massive surge in volume on a 5 minute candle, but the candle body remains small. This lack of follow through suggests that supply is meeting demand at a fixed coordinate. The volume is being absorbed by a passive seller who is not allowing the market open volatility to push through the level.
Identifying the Resistance Level
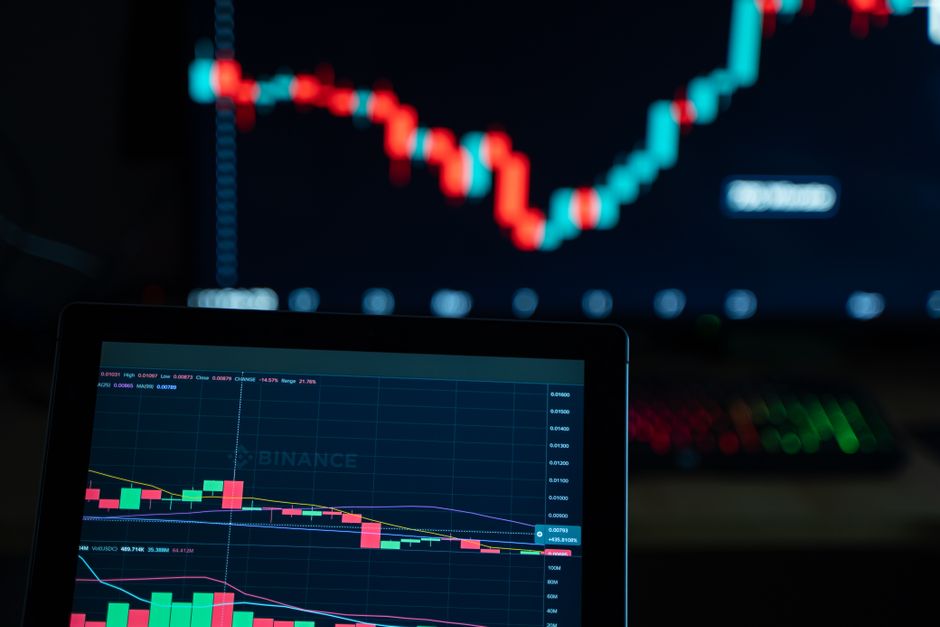
Resistance is frequently established by the high of the opening range. When the price approaches this level and volume increases without a breach, absorption is likely occurring. This is not a false breakout, but rather a heavy liquidity event. The fifteen minute range often provides the first indication of this phenomenon. If the volume profile shows a heavy node at the top of the range, the orders are being filled at that exact price. Monitoring the tape during the first fifteen minutes helps separate aggressive trend followers from passive absorbers.
Volume Profile and Price Stagnation
A high volume node at a resistance level acts as a magnet and a ceiling simultaneously. During regular trading hours, the presence of a large block of orders at a single price prevents the opening range breakout from completing. The volume confirms the presence of a big player, but the price action denies the momentum. This mismatch between volume and price movement is a mechanical signal of absorption. A trader observes the 15 minute chart and sees the volume bars growing while the price oscillates within a tight band.
The Role of Time and Trend
Time plays a role in how these levels hold. If absorption persists through the thirty minute range, the probability of a reversal increases. The lack of expansion during high volume periods suggests that the aggressive side has failed to clear the limit orders. This often leads to a shift in direction as the trapped participants are forced to exit. Watching the session high for these signs prevents entering a trade based on a false sense of momentum. The mechanics of the market dictate that when orders are absorbed, the direction usually follows the side that remains passive.